Stacking
Stacking provides frequency analysis of unique values in any column, presented as bar charts. This technique is fundamental to DFIR analysis — unusual or rare values often indicate malicious activity.
Opening Stacking
- Menu: Tools > Stack Values
- Or
Cmd+Clicka column header and select Stack this column
How It Works
- Select a column to analyze
- IRFlow Timeline queries SQLite for distinct values and their counts using
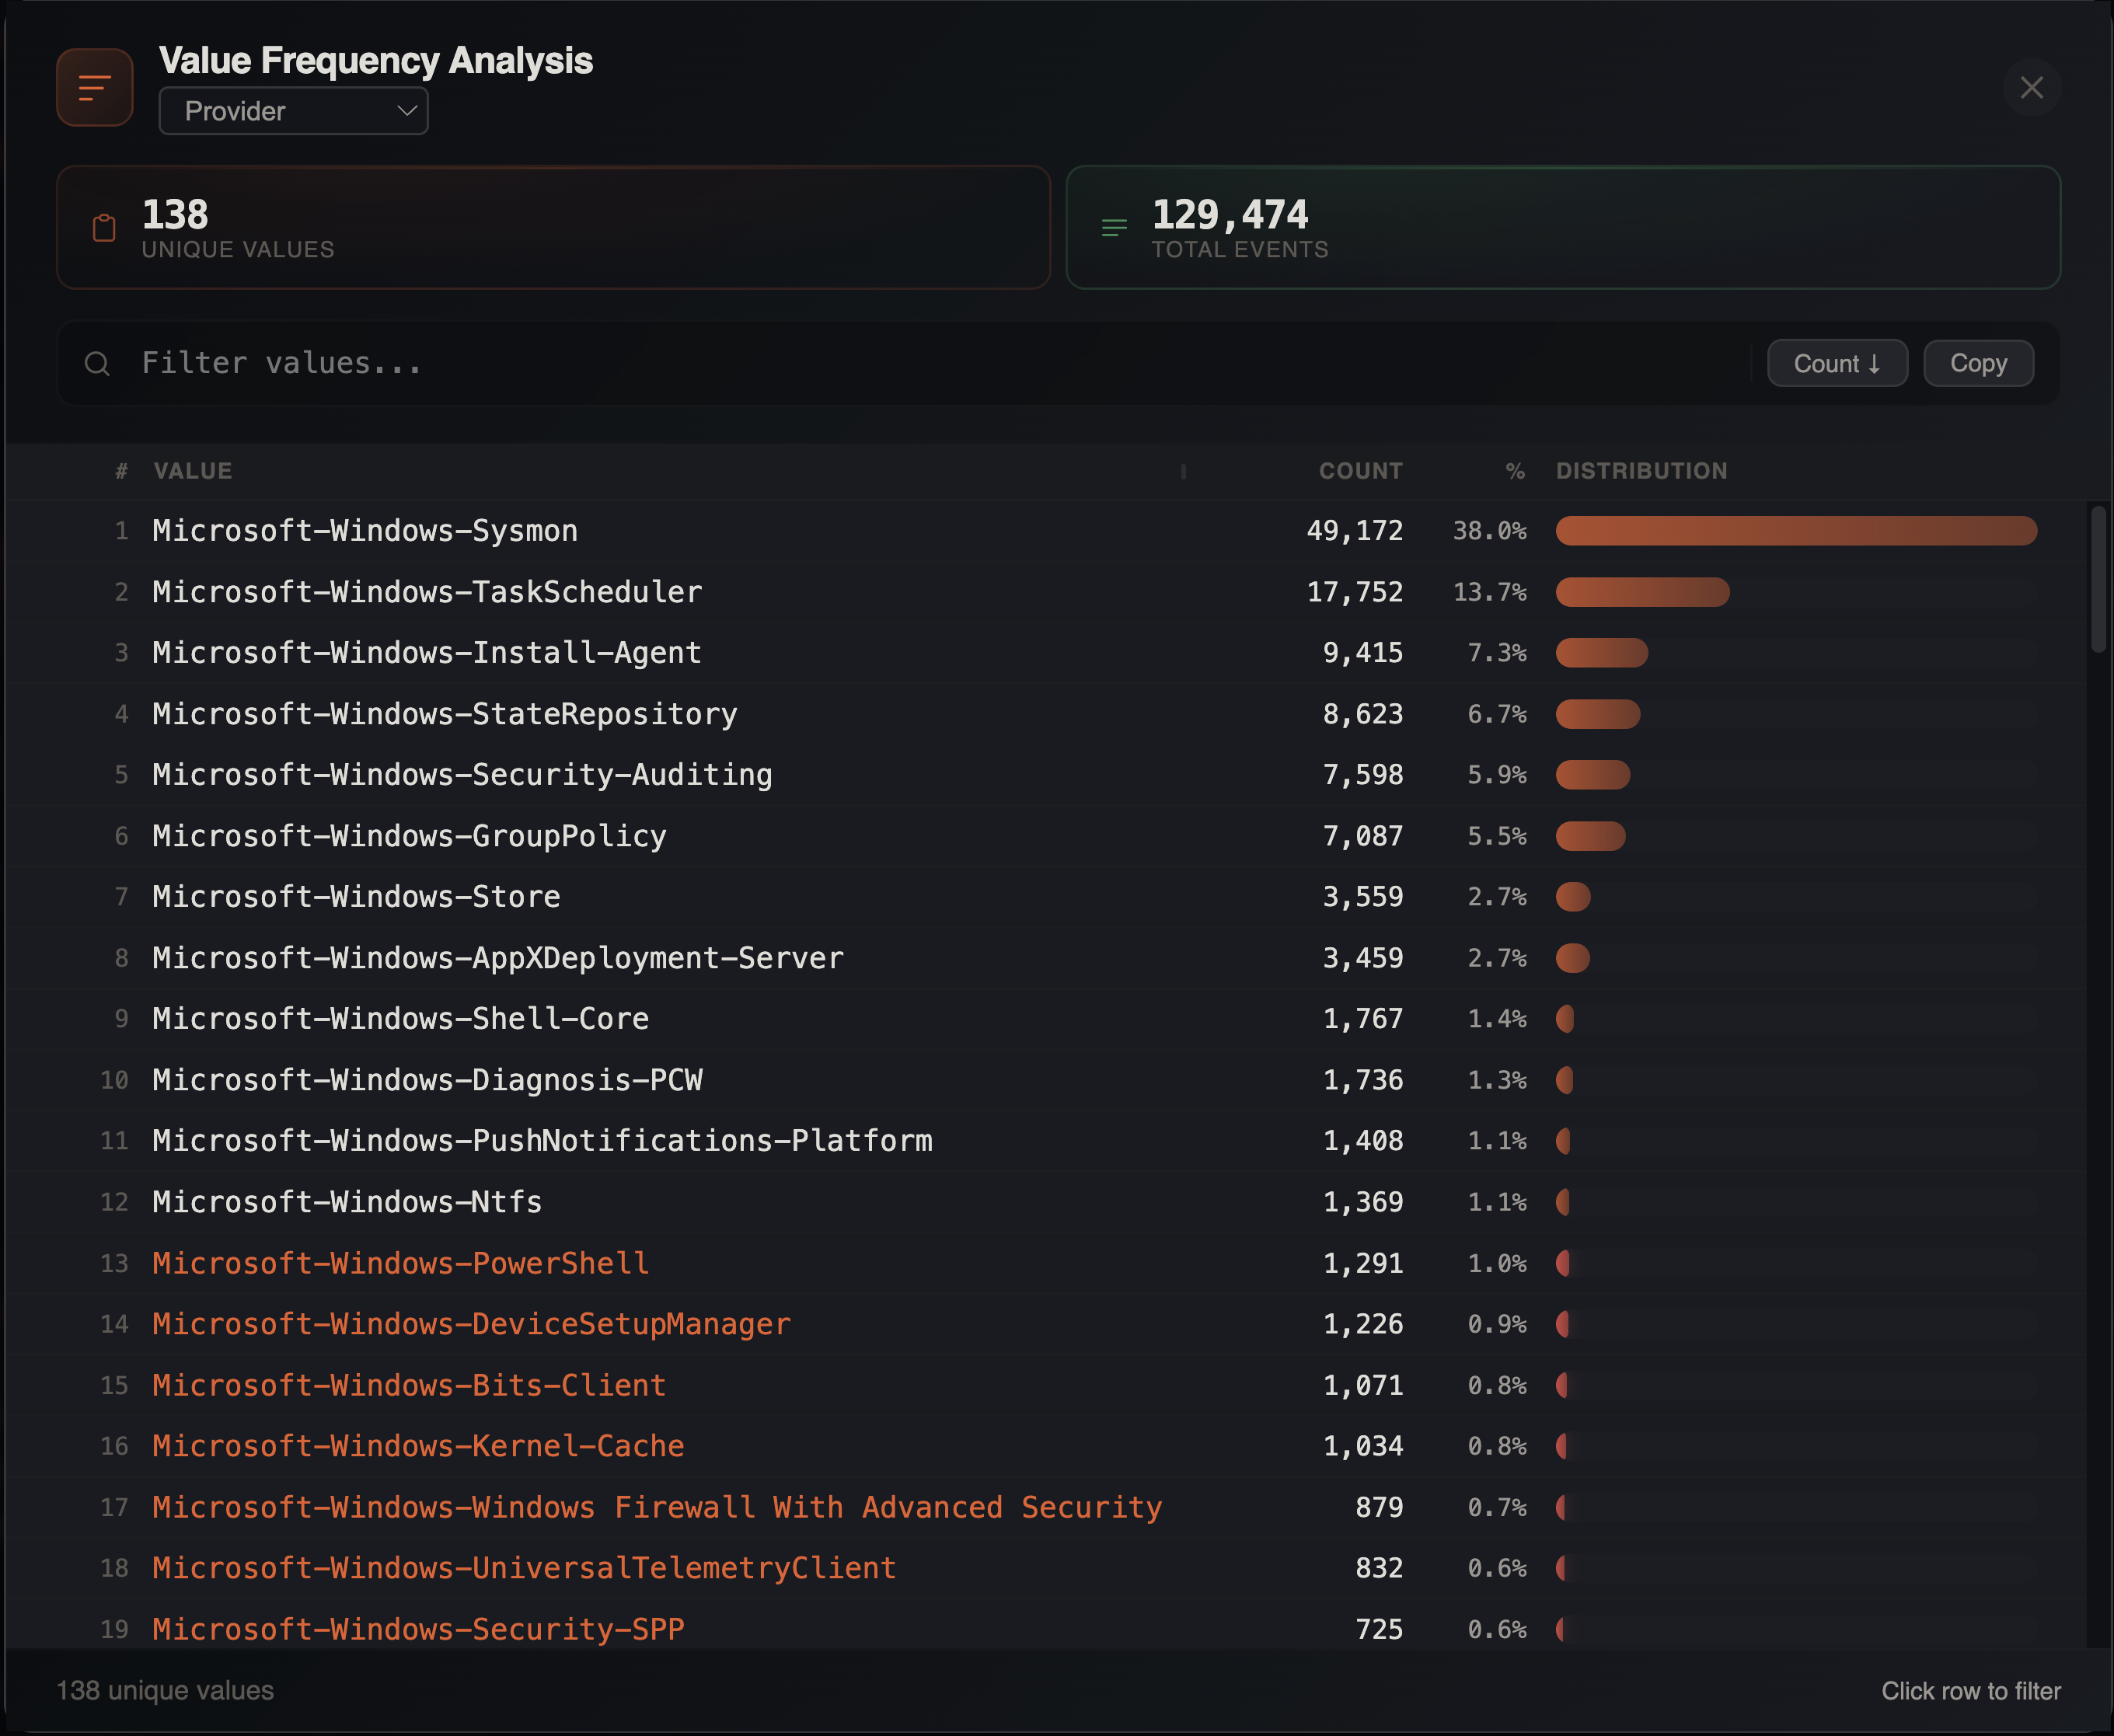
GROUP BYwithCOUNT(*) - Results are displayed in a resizable modal (default 860px wide) with:
- Row index
- Value name (resizable column, default 420px, min 120px)
- Count (absolute number)
- Percentage of total rows
- Visual distribution bar proportional to count with heatmap coloring
Up to 10,000 unique values are returned. If a column exceeds this limit, a truncation notice is displayed.
Stats Cards
Two summary metrics appear above the results:
- Unique values — count of distinct values in the column
- Total events — total rows in the filtered dataset
Sorting
Toggle between two sort modes using the button in the toolbar:
| Mode | Order | Use Case |
|---|---|---|
| Count ↓ | Most frequent first (default) | Find dominant values |
| A→Z | Alphabetical by value | Browse values systematically |
Rare Values
In count mode, scroll to the bottom to find rare values. Values appearing less than 1% of the time are flagged with italic styling. In many forensic scenarios, the most interesting entries are the ones that appear only once or a handful of times — a rare executable, an unusual path, or a one-time network connection.
Search Filter
Type in the filter input to narrow the displayed values in real time. This searches within the value names, not the underlying data — useful for quickly finding a specific value in a large distribution.
Click-to-Filter
Click any value in the stacking table to instantly filter the main grid to rows containing that value via checkbox filter. This provides a quick drill-down workflow:
- Stack a column to see the distribution
- Click an interesting value
- Examine the matching rows in full detail
Copy to Clipboard
Click the copy button to export the full stacking results as tab-separated values (TSV) with headers: Value, Count, Percent. Paste directly into a spreadsheet or report.
Filter Awareness
Stacking respects all active filters — column filters, checkbox filters, date range filters, search terms, advanced filters, and bookmark filters. If you have filters active, the stacking analysis only considers the filtered rows. This lets you answer questions like:
- "What executables ran during the suspicious time window?"
- "What event types are associated with this user account?"
- "Which computers generated the most logon failures?"
Common DFIR Use Cases
| Column | What to Look For |
|---|---|
| Image / Process Name | Unusual executables, LOLBins |
| EventID | Unexpected event types |
| Computer | Hosts with unusual activity volume |
| User | Accounts with anomalous behavior |
| Channel / Provider | Log source distribution |
| Source Address | Unusual network origins |
| Parent Process | Unexpected parent-child relationships |
| Target Path | Unusual file access patterns |
| LogonType | Distribution of authentication methods |
| CommandLine | Repeated or suspicious commands |