Persistence Analyzer
The Persistence Analyzer automatically scans your timeline data for Windows persistence mechanisms, scoring each finding by risk level and organizing results by category. It supports both EVTX event logs and registry exports, detecting over 30 distinct persistence techniques across services, scheduled tasks, WMI subscriptions, registry autorun keys, and more.
Opening the Persistence Analyzer
- Menu: Tools > Persistence Analyzer
Data Source Modes
The analyzer supports three input modes, selectable in the configuration panel:
| Mode | Input Data | Best For |
|---|---|---|
| Auto-detect | Analyzes column names to determine type | Quick start -- let the tool decide |
| EVTX Logs | EvtxECmd CSV or parsed EVTX output | Event-based persistence (services, tasks, WMI) |
| Registry Export | RECmd or other registry CSV output | Registry-based persistence (Run keys, COM hijacks, LSA) |
In auto-detect mode, the analyzer examines your column headers to determine whether the data contains event log fields (EventId, Channel, Provider) or registry fields (KeyPath, ValueName, ValueData).
EVTX Detection Rules
When analyzing event logs, the Persistence Analyzer scans for 27 indicator types across multiple log channels:
Services
| Event ID | Source | Description |
|---|---|---|
| 7045 | System | New service installed |
| 4697 | Security | Service installed (auditing) |
Scheduled Tasks
| Event ID | Source | Description |
|---|---|---|
| 4698 | Security | Scheduled task created |
| 4699 | Security | Scheduled task deleted |
| 106 | Task Scheduler | Task registered |
| 129 | Task Scheduler | Task launch attempt |
| 118 | Task Scheduler | Boot trigger fired |
| 119 | Task Scheduler | Logon trigger fired |
| 140 | Task Scheduler | Task updated |
| 141 | Task Scheduler | Task deleted |
| 200 | Task Scheduler | Task action started |
WMI Persistence
| Event ID | Source | Description |
|---|---|---|
| 5861 | WMI-Activity | WMI permanent event consumer registered |
| Sysmon 19 | Sysmon | WMI event filter created |
| Sysmon 20 | Sysmon | WMI event consumer created |
| Sysmon 21 | Sysmon | WMI filter-to-consumer binding |
Registry Indicators
| Event ID | Source | Category | Description |
|---|---|---|---|
| Sysmon 13 | Sysmon | Registry Autorun | Registry value set (autorun modifications) |
| Sysmon 12 | Sysmon | Registry Modification | Registry key created or deleted |
| Sysmon 14 | Sysmon | Registry Rename | Registry key or value renamed |
File System Indicators
| Event ID | Source | Category | Description |
|---|---|---|---|
| Sysmon 11 | Sysmon | Startup Folder | File created in startup directory |
| Sysmon 7 | Sysmon | DLL Hijacking | Unsigned or suspicious DLL loaded |
| Sysmon 6 | Sysmon | Driver Loading | Suspicious driver loaded |
| Sysmon 25 | Sysmon | Process Tampering | Process tampering detected |
Account Persistence
| Event ID | Source | Description |
|---|---|---|
| 4720 | Security | User account created |
| 4724 | Security | Password reset attempt |
| 4728 | Security | Member added to global security group |
| 4732 | Security | Member added to local security group |
| 4756 | Security | Member added to universal security group |
Registry Detection Rules
When analyzing registry exports, the analyzer checks 15 persistence locations:
| Location | Registry Path | Technique |
|---|---|---|
| Run / RunOnce | HKLM\SOFTWARE\Microsoft\Windows\CurrentVersion\Run | Autostart execution |
| Services | HKLM\SYSTEM\CurrentControlSet\Services\*\ImagePath | Service DLL/binary |
| Winlogon | ...\Winlogon\Shell, Userinit, Notify | Logon persistence |
| AppInit_DLLs | ...\Windows NT\CurrentVersion\Windows\AppInit_DLLs | DLL injection |
| IFEO Debugger | ...\Image File Execution Options\*\Debugger | Debugger hijack |
| COM Hijacking | ...\Classes\CLSID\*\InprocServer32, LocalServer32 | COM object redirect |
| Shell Extensions | ...\ShellIconOverlayIdentifiers, ShellExtensions | Explorer persistence |
| BootExecute | ...\Session Manager\BootExecute | Pre-logon execution |
| BHO | ...\Browser Helper Objects | Browser persistence |
| LSA Packages | ...\LSA\Security Packages, Authentication Packages | Security provider |
| Print Monitors | ...\Print\Monitors\*\Driver | Spoolsv persistence |
| Active Setup | ...\Active Setup\Installed Components\*\StubPath | Per-user execution |
| Startup Folder | ...\Explorer\User Shell Folders\Startup | Startup redirect |
| Scheduled Tasks | ...\Schedule\TaskCache\Tasks | Task registry entries |
| Network Providers | ...\NetworkProvider\Order | Network logon persistence |
Custom Rules Editor
The configuration panel includes a collapsible Detection Rules section where you can manage both built-in and custom rules.
Managing Built-in Rules
Each built-in EVTX and registry rule has a checkbox toggle. Disable rules that generate noise for your specific environment without removing them. Disabled rules are skipped during analysis.
Creating Custom Rules
Click Add Custom Rule to create a new detection rule:
EVTX custom rules:
| Field | Description |
|---|---|
| Category | Grouping label shown in results (e.g., "Custom Persistence") |
| Rule Name | Descriptive name for the detection |
| Event IDs | Comma-separated list of Windows Event IDs to match |
| Channels | Comma-separated log channels to filter (optional) |
| Payload Regex | Regular expression to filter on event payload content (optional) |
| Severity | Critical, High, Medium, or Low |
Registry custom rules:
| Field | Description |
|---|---|
| Category | Grouping label shown in results |
| Rule Name | Descriptive name for the detection |
| Key Path Pattern | Regex matching the registry key path |
| Value Name Filter | Regex filtering the value name (optional) |
| Severity | Critical, High, Medium, or Low |
Custom rules are evaluated alongside built-in rules and appear in results with the same scoring and filtering behavior.
Risk Scoring
Each detected persistence mechanism receives a risk score on a 0-10 scale. The score is calculated from:
- Base severity -- determined by the persistence technique category (e.g., WMI subscriptions score higher than Run keys)
- Suspicious path indicators -- execution from
\Temp\,\AppData\,\Downloads\, or\ProgramData\increases the score - Suspicious commands -- presence of
powershell,cmd.exe, encoded commands, or known LOLBins raises the score - Encoding and download cradle detection -- Base64-encoded command lines, obfuscated payloads, or PowerShell download cradles (
iex,Invoke-Expression,DownloadString,WebClient,BITSTransfer) add to the score
Severity Levels
| Level | Score Range | Color |
|---|---|---|
| Critical | 9-10 | Red |
| High | 6-8 | Orange |
| Medium | 3-5 | Yellow |
| Low | 0-2 | Gray |
Suspicious Detection Badges
Beyond the numeric risk score, findings can receive a red SUSPICIOUS badge when specific behavioral patterns are detected:
| Detection | Trigger |
|---|---|
| Non-standard task path | Task name doesn't start with a known-good prefix (\Microsoft\, \Google\, etc.) |
| GUID-named task | Task name is a bare GUID (e.g., \{6D3B4F8C-1234-...}) — often used by malware to blend in |
| LOLBin execution | Command uses powershell, cmd.exe, mshta, wscript, or cscript in a non-Microsoft task or service |
| User-writable path | Executable runs from \Users\, \Temp\, \AppData\, \Downloads\, or \Public\ |
| Non-standard task deleted | Event ID 141 for a non-Microsoft task — potential anti-forensics indicator |
| Browser mimicry | Service uses a browser name (Chrome, Edge, Firefox) but runs from a non-standard path |
RMM Tool Detection
Service installations (Event ID 7045) matching known Remote Monitoring and Management tool names are flagged with an orange RMM badge. Detected tools include:
AnyDesk, Splashtop, RustDesk, Atera, ScreenConnect, TeamViewer, Supremo, ConnectWise, Bomgar, LogMeIn
RMM tools are not inherently malicious, but they are high-confidence indicators in ransomware and unauthorized access investigations. The badge helps analysts quickly identify remote access tooling in the environment.
AV/EDR and Browser Whitelisting
The analyzer automatically suppresses known-legitimate findings to reduce noise:
- AV/EDR vendors — Service installations from 15 vendors (Cortex XDR, Microsoft Defender, CrowdStrike, SentinelOne, Carbon Black, Sophos, Symantec, McAfee/Trellix, Kaspersky, ESET, Trend Micro, Bitdefender, Cylance, Elastic, Fortinet) are suppressed when they match expected installation paths
- Browser update services — Chrome, Edge, Firefox, Brave, Opera, and Vivaldi update services from expected
Program Filespaths are downgraded to low severity
This whitelisting prevents hundreds of false-positive service events from cluttering results while preserving detection of the same service names running from unexpected paths (flagged as browser mimicry).
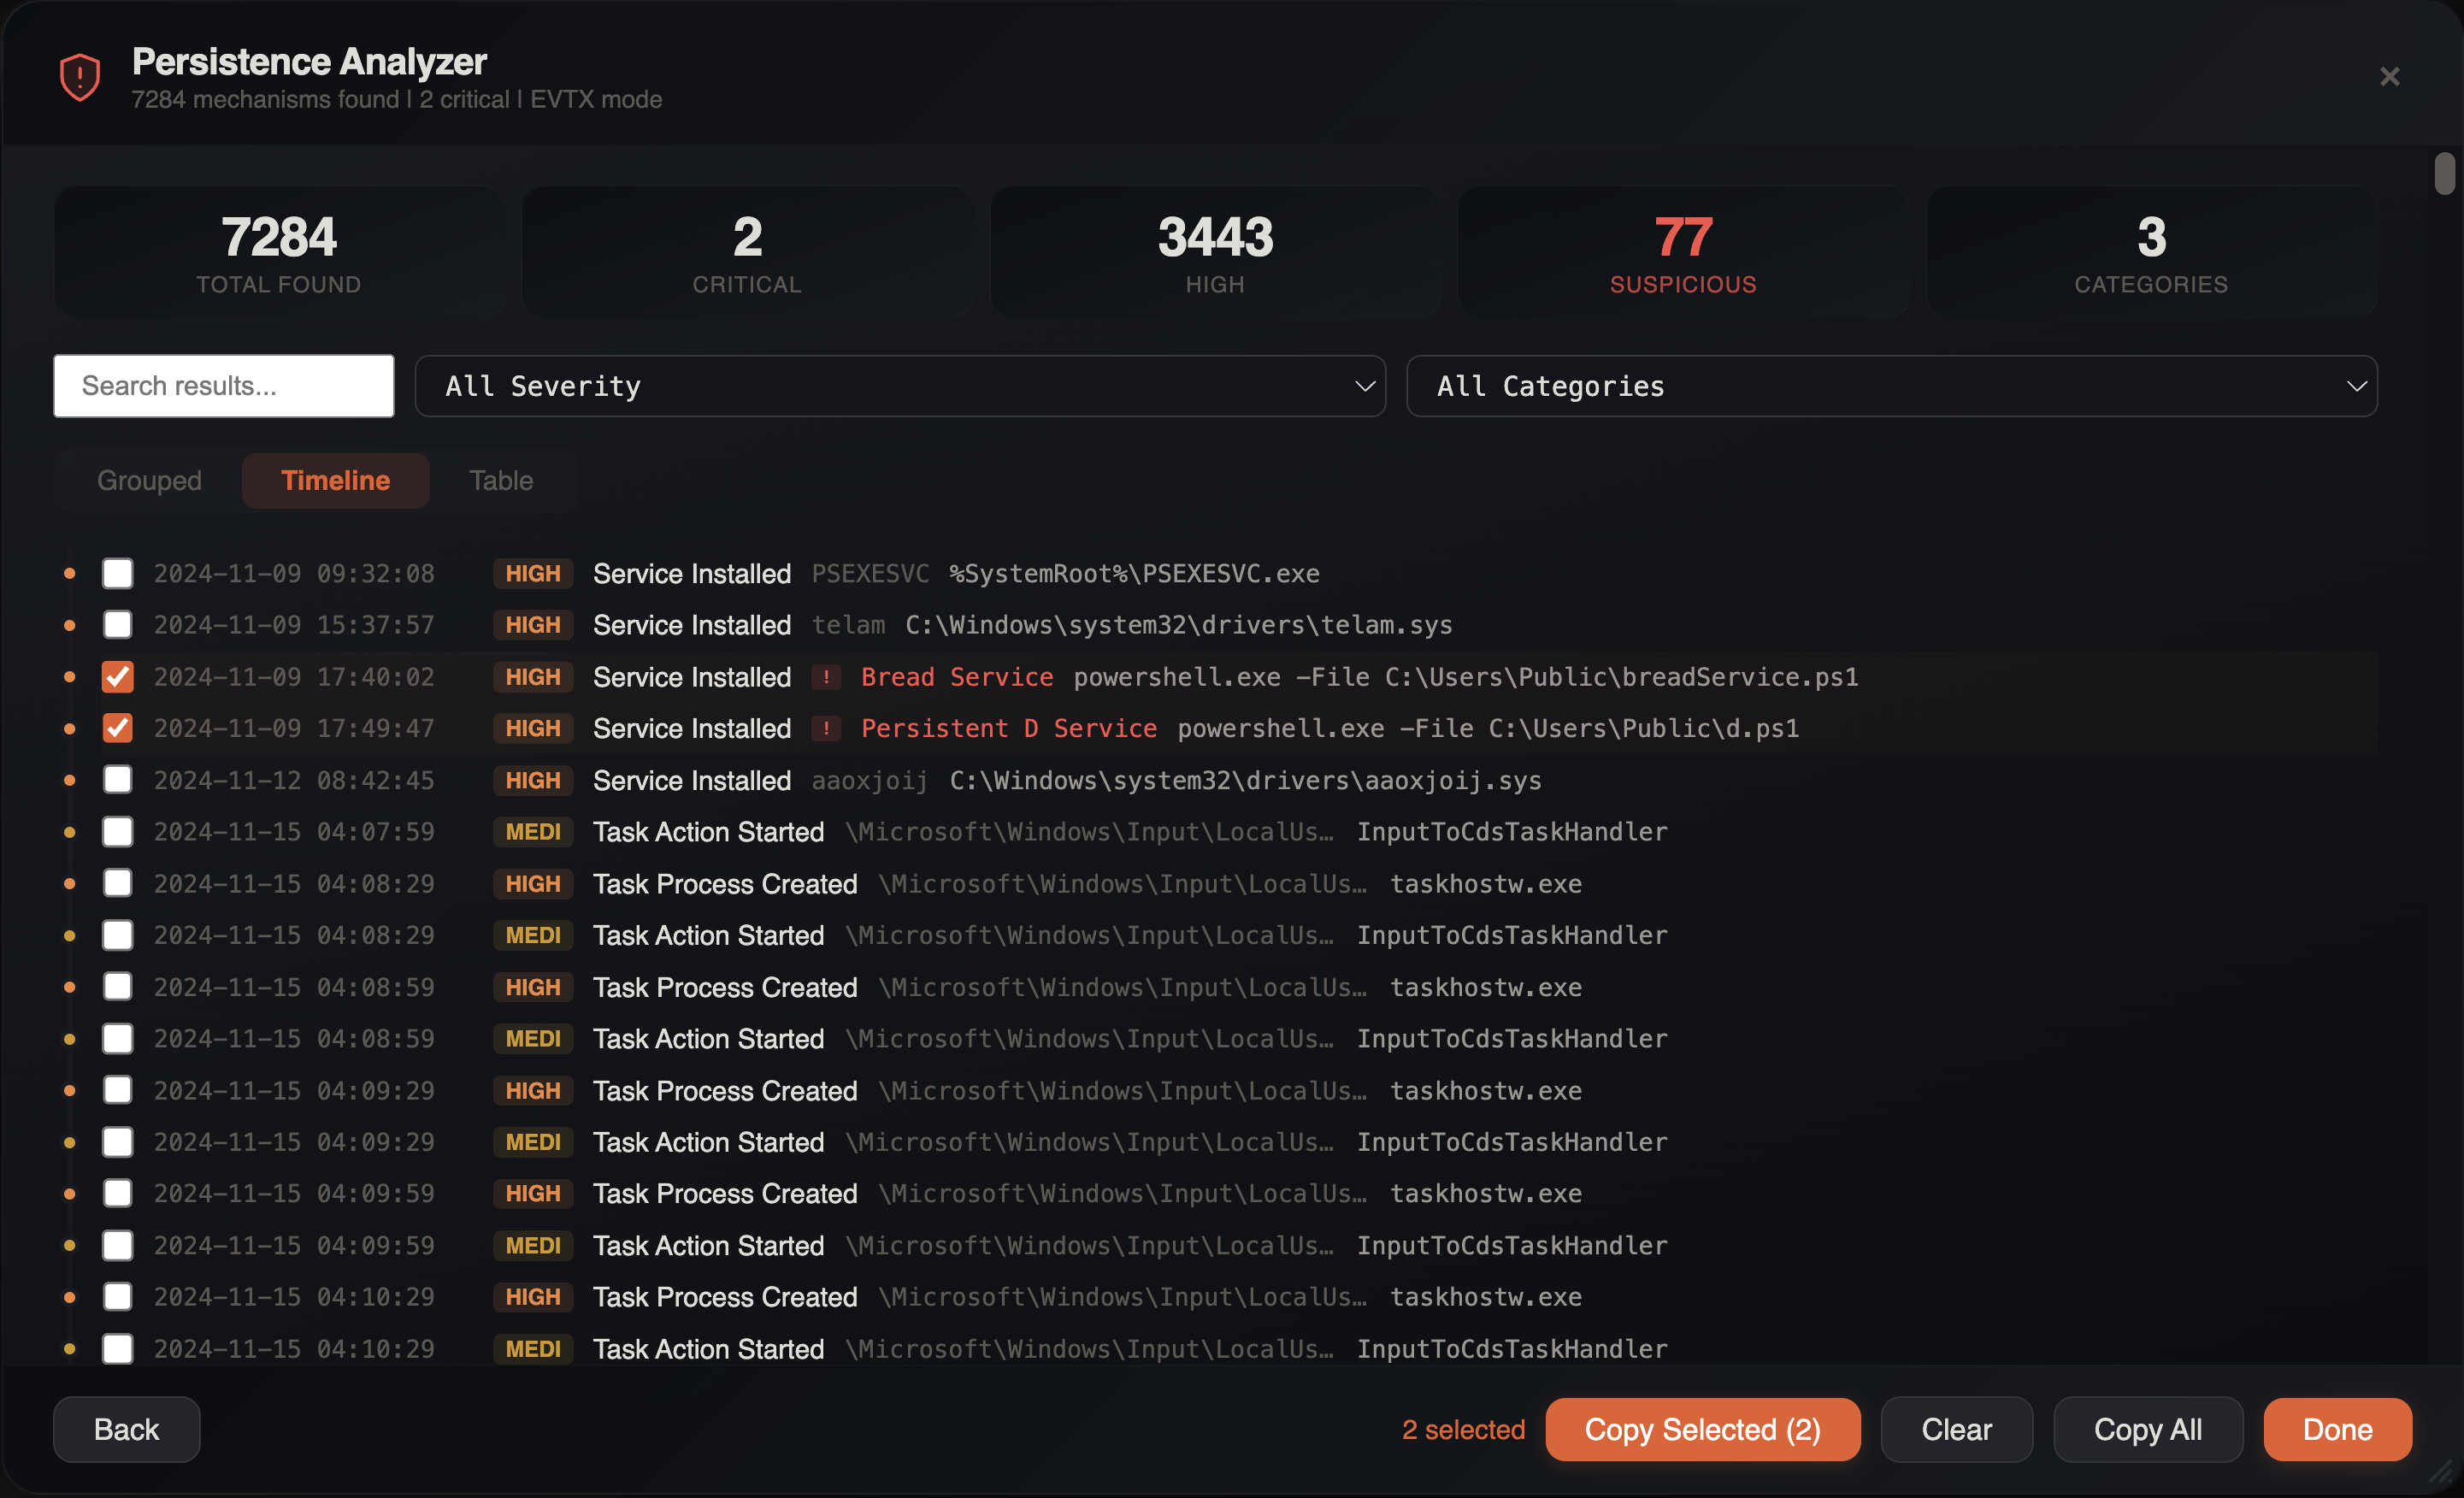
Results Interface
After the scan completes, the results panel displays five key statistics:
- Total Found -- total number of persistence mechanisms detected
- Critical -- count of critical-severity findings
- High -- count of high-severity findings
- Suspicious -- count of findings with behavioral detection badges
- Categories -- number of distinct persistence categories
Filtering Results
The results panel includes a filter bar with:
- Search -- full-text search across all findings
- Severity filter -- show only critical, high, medium, or low findings
- Category filter -- filter by persistence type (Services, Scheduled Tasks, WMI, Registry Autorun, DLL Hijacking, etc.)
View Modes
Results can be displayed in three different layouts:
Grouped View
Findings organized under collapsible category headers (e.g., "Services", "Scheduled Tasks", "WMI Subscriptions", "Registry Autorun", "DLL Hijacking", "Driver Loading", "Process Tampering"). Each category shows its finding count. Up to 200 items are displayed per category.
Timeline View
Findings sorted chronologically, showing when each persistence mechanism was installed. This view reveals the temporal sequence of persistence activity and is limited to 500 items for performance.
Table View
A flat tabular view of all findings with sortable columns. No item limit -- all findings are displayed.
Item Details
Click any finding to expand its details panel showing:
- Full registry path or event log entry
- Command line or executable path
- Timestamp of installation
- Associated user account
- Source host
- Risk score breakdown
- Suspicious reason badges (if any)
Bulk Operations
Use the checkbox selection to select multiple findings for:
- Bulk tagging in the source timeline
- Filtering the source tab to selected items
- Exporting selected findings
Cross-Event Correlation
The analyzer automatically correlates related events. For example:
- A scheduled task creation (Event ID 4698) is enriched with the task executable extracted from the XML task definition
- Service installations (Event ID 7045) are correlated with their
ImagePathto identify the binary - WMI subscriptions link filter, consumer, and binding events into a single finding
Filter Awareness
The Persistence Analyzer respects all active filters on the source tab:
- Column filters
- Checkbox filters
- Search terms
- Date range filters
- Bookmark filter
- Advanced filters
This means you can narrow your timeline to a specific time window or host before running the analysis, focusing results on the scope that matters.
Investigation Tips
Start with Auto-Detect
Let the analyzer auto-detect your data mode. It correctly identifies EVTX vs registry data in most cases and saves configuration time.
Focus on Critical and High
Sort by severity and start with critical/high findings. Low-severity items often represent legitimate system services and can be reviewed later if needed.
Check the SUSPICIOUS Badge
Findings with the red SUSPICIOUS badge deserve immediate attention. GUID-named tasks, LOLBin execution from non-Microsoft services, and anti-forensics task deletion are strong indicators of compromise.
RMM Tools in Ransomware Cases
In ransomware investigations, check the RMM-tagged findings first. Threat actors commonly deploy AnyDesk, ScreenConnect, or Splashtop for persistent remote access before deploying ransomware.
Combine with Process Inspector
After identifying a suspicious persistence mechanism, use the Process Inspector to trace what process installed it and what the persisted binary spawns on execution.
Correlate with Lateral Movement
Persistence is often installed after lateral movement. Cross-reference persistence timestamps with the Lateral Movement Tracker to identify which hop preceded each persistence installation.