Log Source Coverage
Log Source Coverage provides a Gantt-style visualization of which log sources are present across your timeline, their time spans, and event counts — helping you identify collection gaps and verify evidence completeness.
Opening Log Source Coverage
- Menu: Tools > Log Sources
Configuration
Source Column
Select the column that identifies your log sources. The dropdown auto-detects and suggests common source columns:
| Auto-Detected Pattern | Typical Tool |
|---|---|
Provider | EvtxECmd, EVTX |
Channel | EvtxECmd, EVTX |
source / Source / _Source | Plaso, merged timelines |
data_type / DataType | Plaso |
parser | Plaso |
log_source | Generic |
EventLog | Hayabusa, Chainsaw |
SourceName / SourceLong | EvtxECmd |
ArtifactName | KAPE tools |
sourcetype | Splunk exports |
Other columns are available below the suggested list.
Timestamp Column
Select which timestamp column to use for time span calculation from your detected timestamp columns.
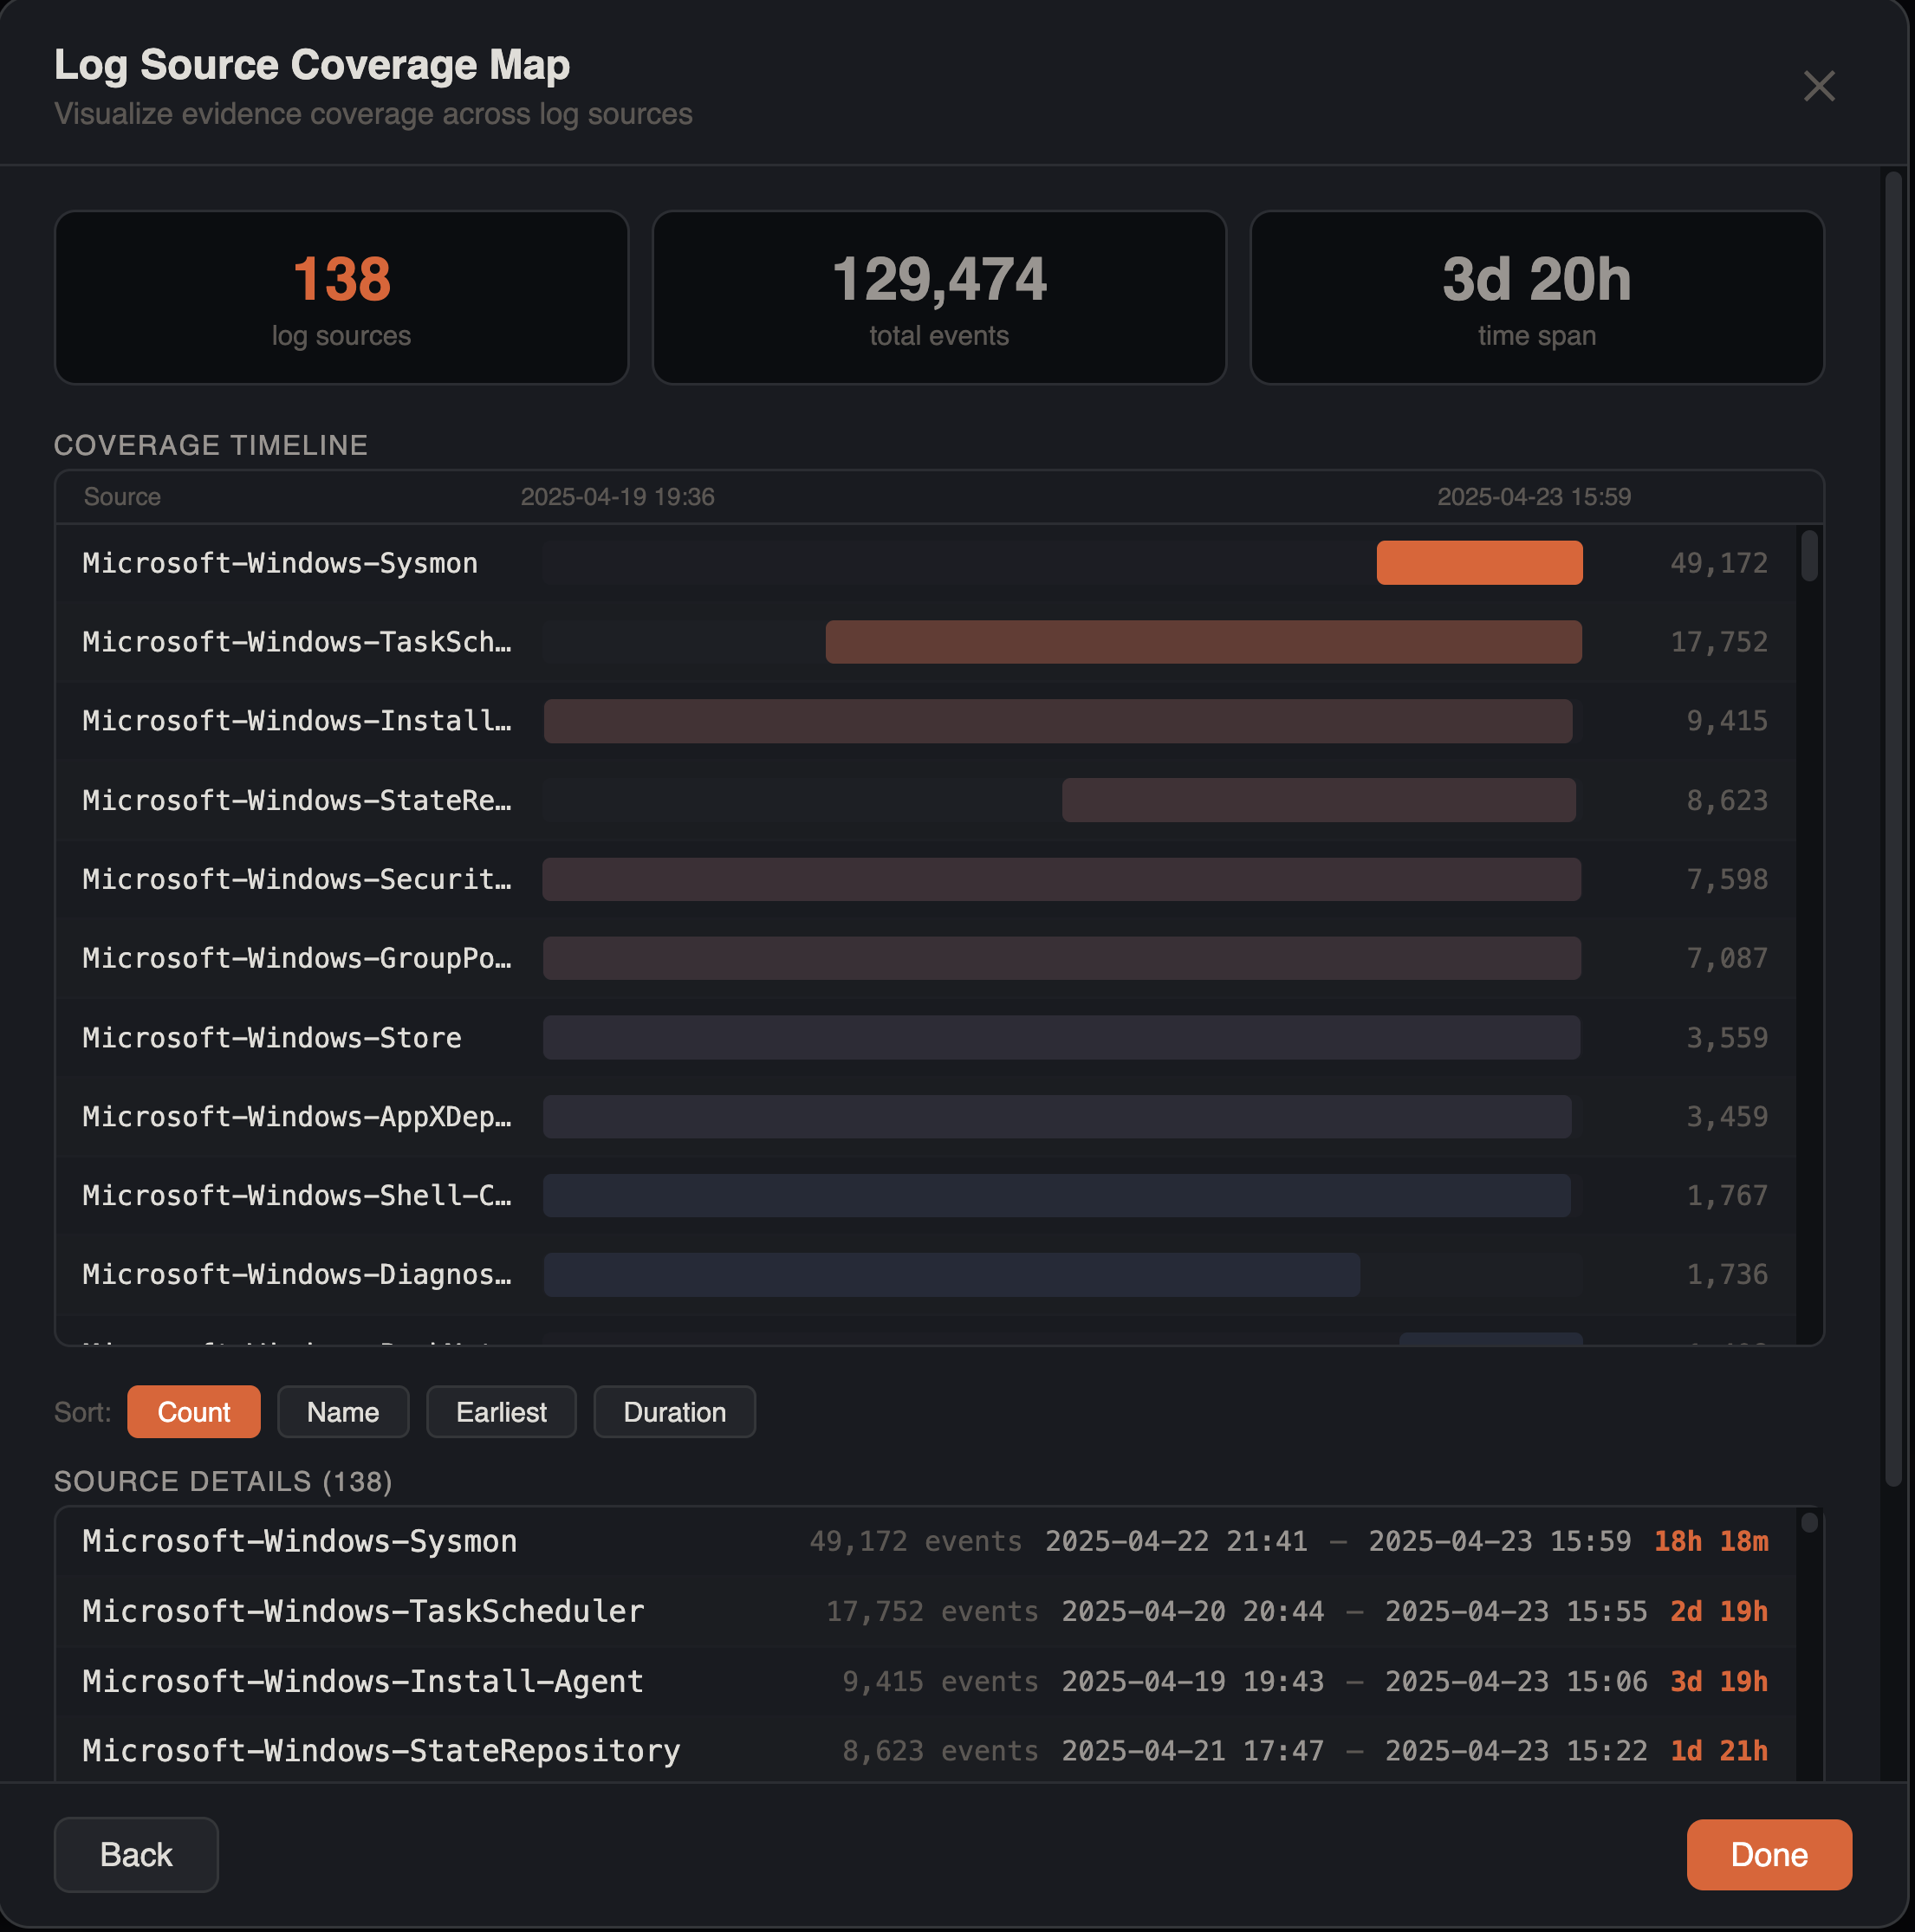
What It Shows
After analysis, the coverage map displays each log source as a horizontal row with:
- Source name — the log source identifier (clickable)
- Gantt bar — visual bar spanning from the source's earliest to latest event, scaled to the global timeline range. Bar color uses heatmap intensity based on event count percentile
- Event count — total events for that source
- Time range — earliest and latest timestamps (YYYY-MM-DD HH:MM format)
- Duration — time span of that source's data, formatted as minutes, hours, or days (e.g.,
45m,3h 20m,2d 5h)
Sources are sorted by event count descending by default, placing the most active sources at the top.
Summary Cards
Two metrics appear above the results:
- Log sources — number of distinct sources detected
- Total events — total events across all sources
Click-to-Filter
Click any source row to filter the main data grid to events from that source only. This provides a fast workflow for investigating individual log sources.
Identifying Gaps
Coverage gaps are visually apparent as missing or short bars compared to the global timeline span. Common patterns:
| Gap Pattern | Possible Cause |
|---|---|
| Single source goes dark while others continue | Log tampering, service stopped |
| All sources go dark simultaneously | System offline, power loss |
| Source starts later than others | Collection began after incident |
| Source ends earlier than others | Collection stopped prematurely |
| Source has a narrow bar despite long timeline | Intermittent logging, rotation issues |
Filter Awareness
Log source coverage respects all active filters — column filters, checkbox filters, date range filters, search terms, advanced filters, and bookmark filters. This lets you analyze coverage within a specific time window or for a subset of events.
Investigation Workflow
- Open Log Source Coverage to get the big picture of your data
- Identify any gaps in expected log sources
- Cross-reference with Gap Analysis for precise gap timestamps
- Verify whether gaps align with known maintenance windows or are suspicious
- Click sources of interest to drill into their events
Tips
Evidence Validation
Run coverage analysis early in your investigation to ensure you have complete data before drawing conclusions. Missing log sources can lead to incorrect timelines.
Multi-Source Correlation
When merging multiple timelines, check coverage to ensure overlapping time ranges. Sources that don't overlap in time provide limited correlation value.
Compare Host-by-Host
In merged multi-host timelines, filter to each host before running coverage analysis. This reveals per-host collection quality and helps identify hosts with incomplete evidence.