Gap & Burst Analysis
Gap and burst analysis help you identify temporal anomalies in your timeline — periods of unusual inactivity or suspicious spikes of activity.
Gap Analysis
What It Detects
Gap analysis identifies periods where no events were recorded, which may indicate:
- Log tampering — attacker cleared or stopped logging
- System downtime — host was offline
- Collection gaps — incomplete log collection
- Normal idle periods — after-hours quiet time
How to Use
- Open Tools > Gap Analysis
- Select the timestamp column to analyze
- Set the gap threshold — minimum duration to consider as a gap
| Preset | Duration |
|---|---|
| 15 min | Short gaps — quick service restarts |
| 30 min | Medium gaps |
| 60 min | Default — standard activity gaps |
| 2 hours | Extended gaps |
| 8 hours | Long gaps — overnight or weekend |
| Custom | Any minute value |
How It Works
- Events are bucketed by minute using
extract_datetime_minute()in SQL - Minute-level buckets are grouped into sessions — continuous sequences of activity without exceeding the gap threshold
- Silence periods between sessions that exceed the threshold are reported as gaps
- No in-memory sorting required — SQLite handles the ordering
Results
Summary cards display three metrics:
- Sessions — number of distinct activity periods detected
- Gaps — number of silence periods exceeding the threshold
- Total events — events in the filtered dataset
Sessions list shows each activity period with:
- Session index badge with color coding (cycles through 8 colors)
- Time range (from → to)
- Event count within the session
- Duration
Gaps list shows each quiet period with:
- Pause icon
- Time range (last event before → first event after)
- Duration in minutes/hours
Click to Zoom
Click any session or gap row to zoom the main grid's date range filter to that time window. Timestamps are converted to second-level precision for accurate filtering.
Tag Sessions
Click Tag Sessions to auto-tag all events within each session. Tags are named Session 1, Session 2, etc. and assigned distinct colors from an 8-color palette. A confirmation shows the total rows tagged across all sessions.
Investigation Tips
Compare Sources
Run gap analysis on individual log sources (filter by channel/source first). A gap in Security logs while System logs continue recording is a strong indicator of log tampering.
Correlate with Activity
Check what happened immediately before and after each gap. If the pre-gap event is suspicious (e.g., service stop, audit policy change), investigate further.
Burst Analysis
What It Detects
Burst analysis identifies abnormal spikes in event volume that stand out from the baseline activity. Spikes may indicate:
- Brute force attacks — rapid authentication attempts
- Data exfiltration — high-volume file access
- Automated tools — scripts or malware generating many events
- Lateral movement — rapid logon events across systems
How to Use
- Open Tools > Burst Detection
- Select the timestamp column to analyze
- Configure the detection parameters:
Window size — aggregation interval:
| Preset | Best For |
|---|---|
| 1 min | Precise spike detection |
| 5 min | Default — general burst detection |
| 15 min | Broader activity windows |
| 30 min | Extended patterns |
| 1 hour | Coarse-grained analysis |
| Custom | Any minute value |
Threshold multiplier — how many times above baseline qualifies as a burst:
| Preset | Sensitivity |
|---|---|
| 3× | High sensitivity — more bursts detected |
| 5× | Default — balanced detection |
| 10× | Low sensitivity — only major spikes |
| 20× | Very low — extreme anomalies only |
| Custom | Any value (step 0.5) |
How It Works
The algorithm runs in six steps:
- Minute bucketing — events grouped by minute using SQL
- Window aggregation — minute buckets combined into windows of the configured size. For 1-minute windows, minute buckets are used directly
- Median baseline — the median event count across all windows becomes the baseline (minimum 1 to avoid division by zero)
- Threshold calculation —
baseline × multipliersets the burst threshold - Burst detection and merging — windows exceeding the threshold are flagged, and adjacent burst windows are merged into contiguous burst periods
- Sparkline generation — all windows mapped to
{timestamp, count, isBurst}for visualization
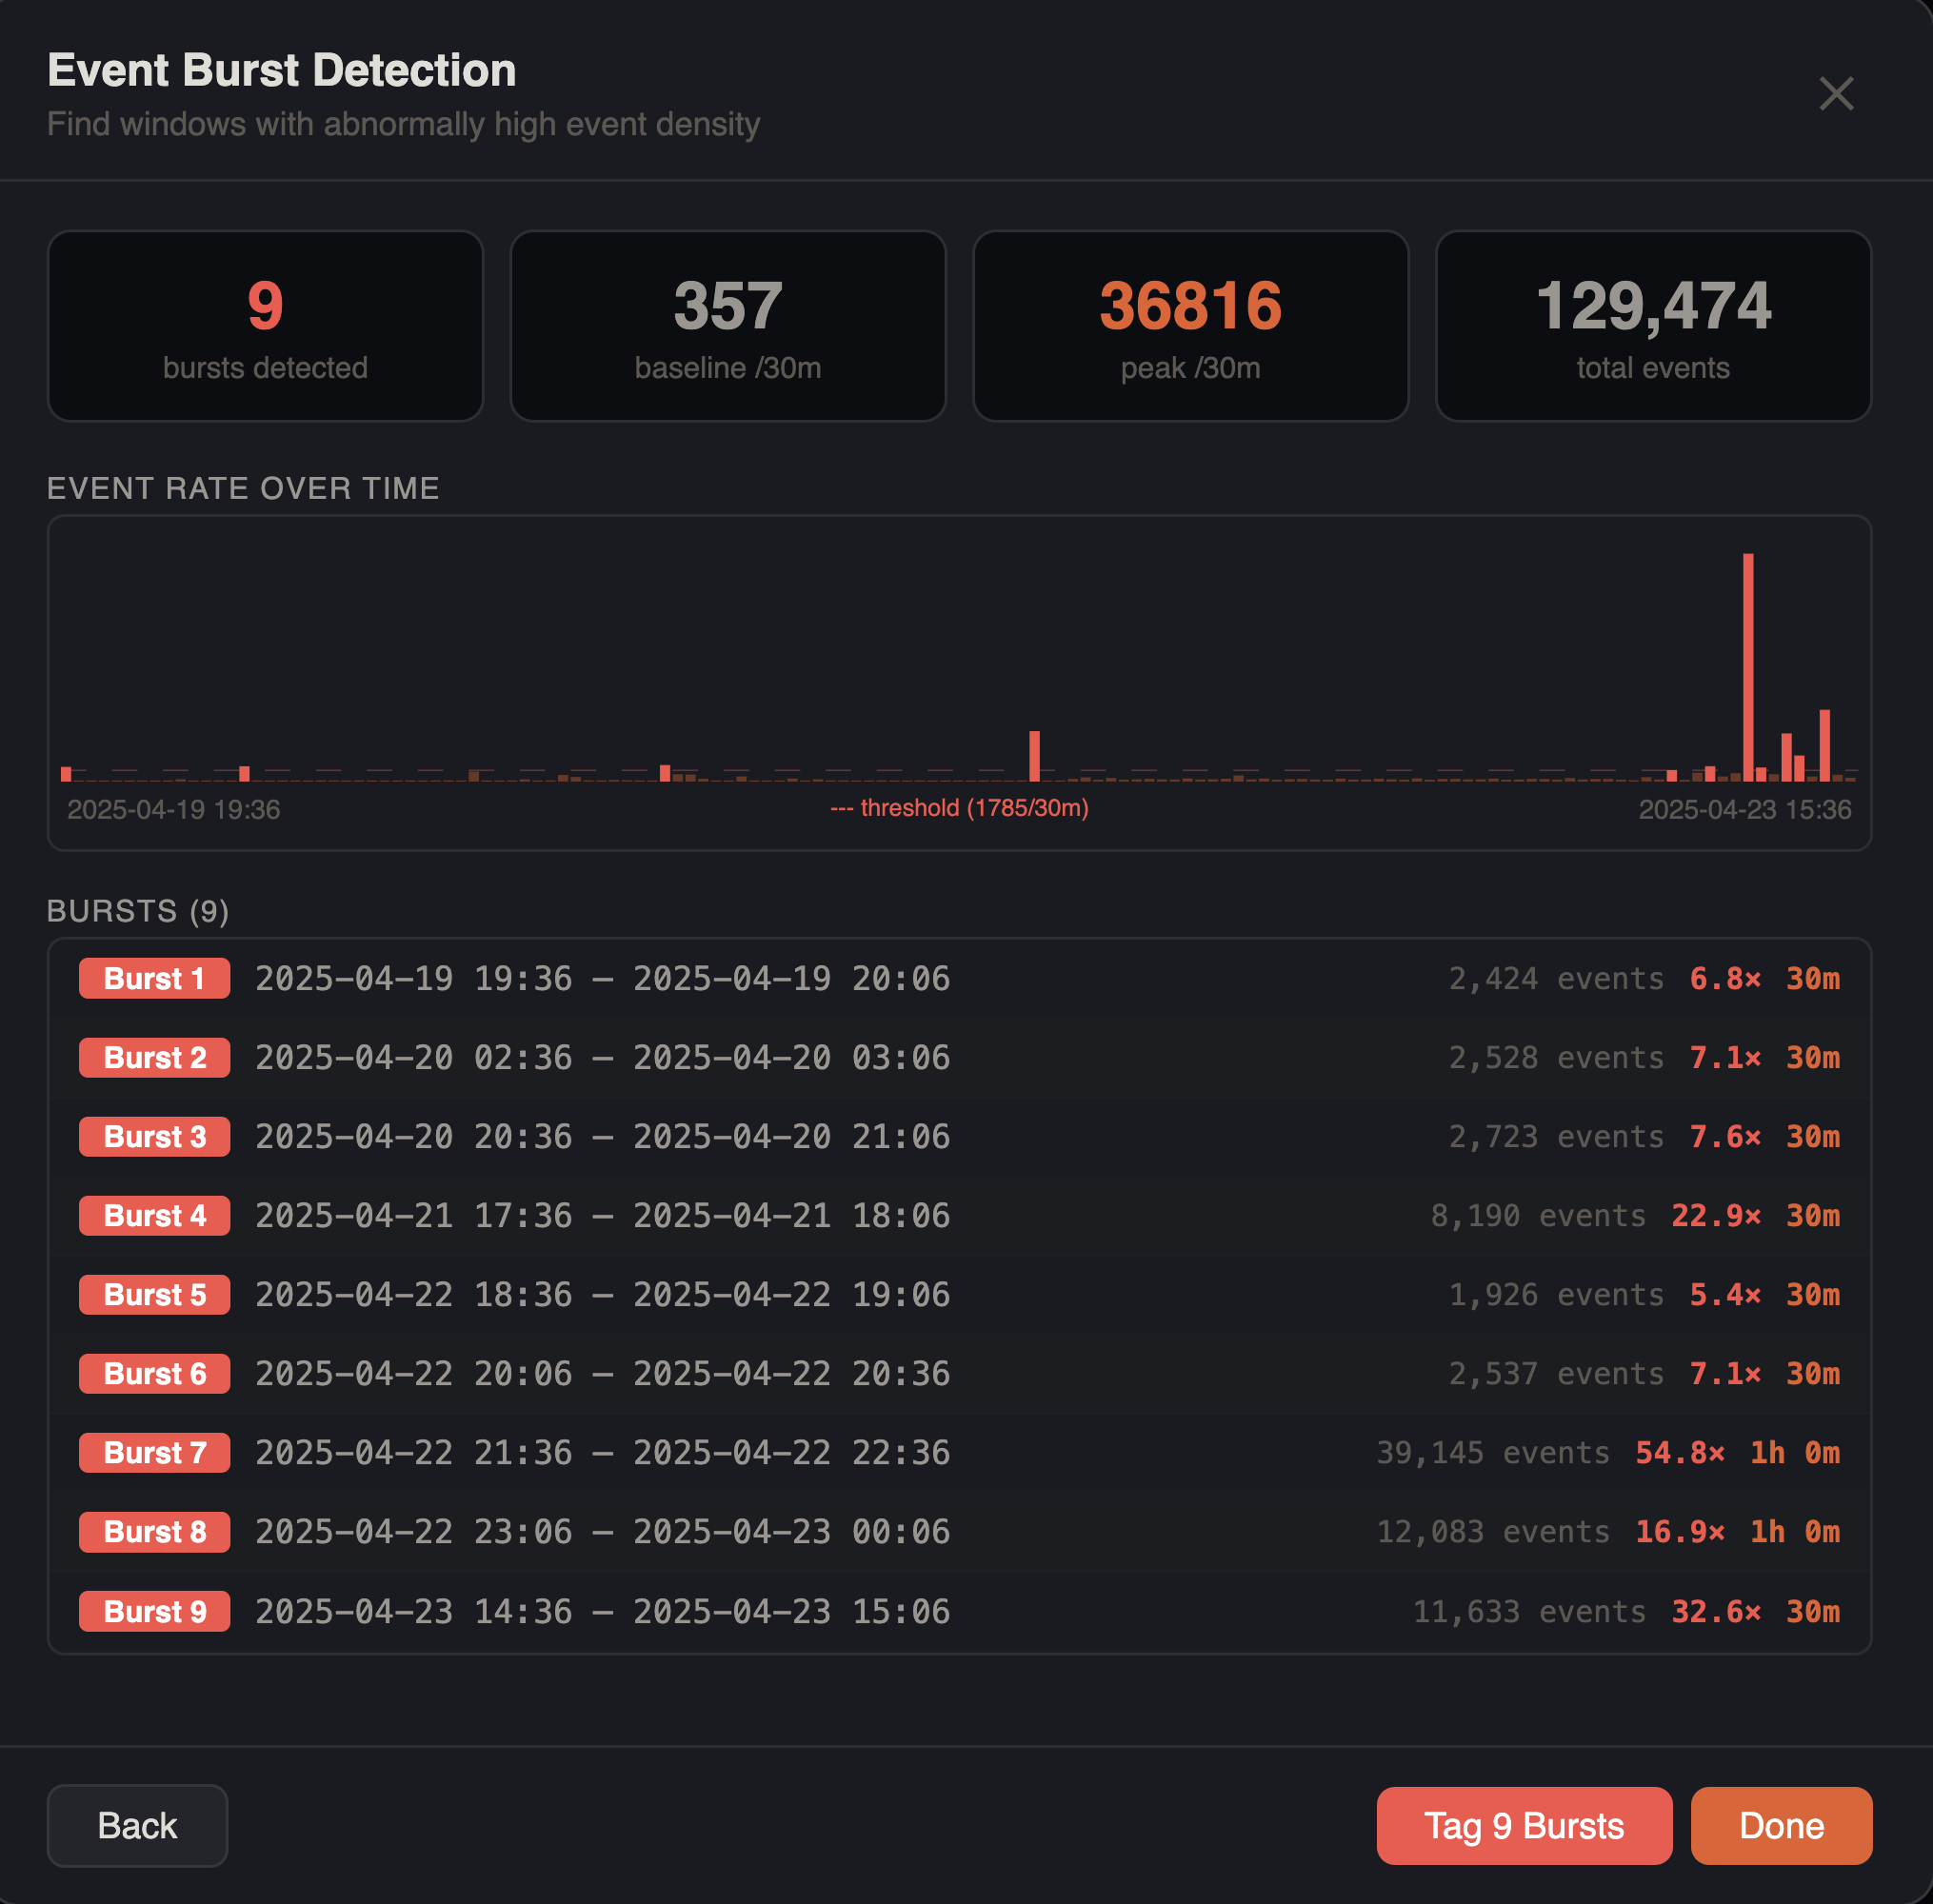
Results
Summary cards display four metrics:
- Bursts — number of burst periods detected (highlighted red if any found)
- Baseline — median events per window period
- Peak rate — maximum events in any single window
- Total events — events in the filtered dataset
Sparkline chart shows event density across the entire timeline:
- Red bars for burst windows, blue bars for normal windows
- Red dashed horizontal line at the threshold level
- Labels showing earliest timestamp, threshold value, and latest timestamp
Bursts list shows each detected burst with:
- Red "Burst N" badge
- Time range (from → to)
- Event count
- Burst factor (e.g.,
×4.2) — ratio of burst activity to baseline - Duration
Click to Zoom
Click any burst row to zoom the main grid's date range filter to that burst window.
Tag Bursts
Click Tag Bursts to auto-tag all events within each burst period. Tags are named Burst 1, Burst 2, etc. and assigned colors from a red-heavy 8-color palette. A confirmation shows the total rows tagged.
Filter Awareness
Both gap and burst analysis respect all active filters — column filters, checkbox filters, search terms, date range filters, advanced filters, and bookmark filters. This lets you narrow your timeline before analysis, for example filtering to authentication events only and then looking for brute force bursts.
Investigation Tips
Narrow the Window
Start with a larger window (15–30 min) to find general areas of interest, then narrow to 1–5 minutes for precise spike identification.
Filter First
Apply filters before running burst analysis. For example, filter to authentication events only and then look for bursts to find brute force attempts.
Cross-Reference
After identifying a burst, click to zoom into that time range and examine the individual events. Look for repeated patterns — same source, same target, same event type.