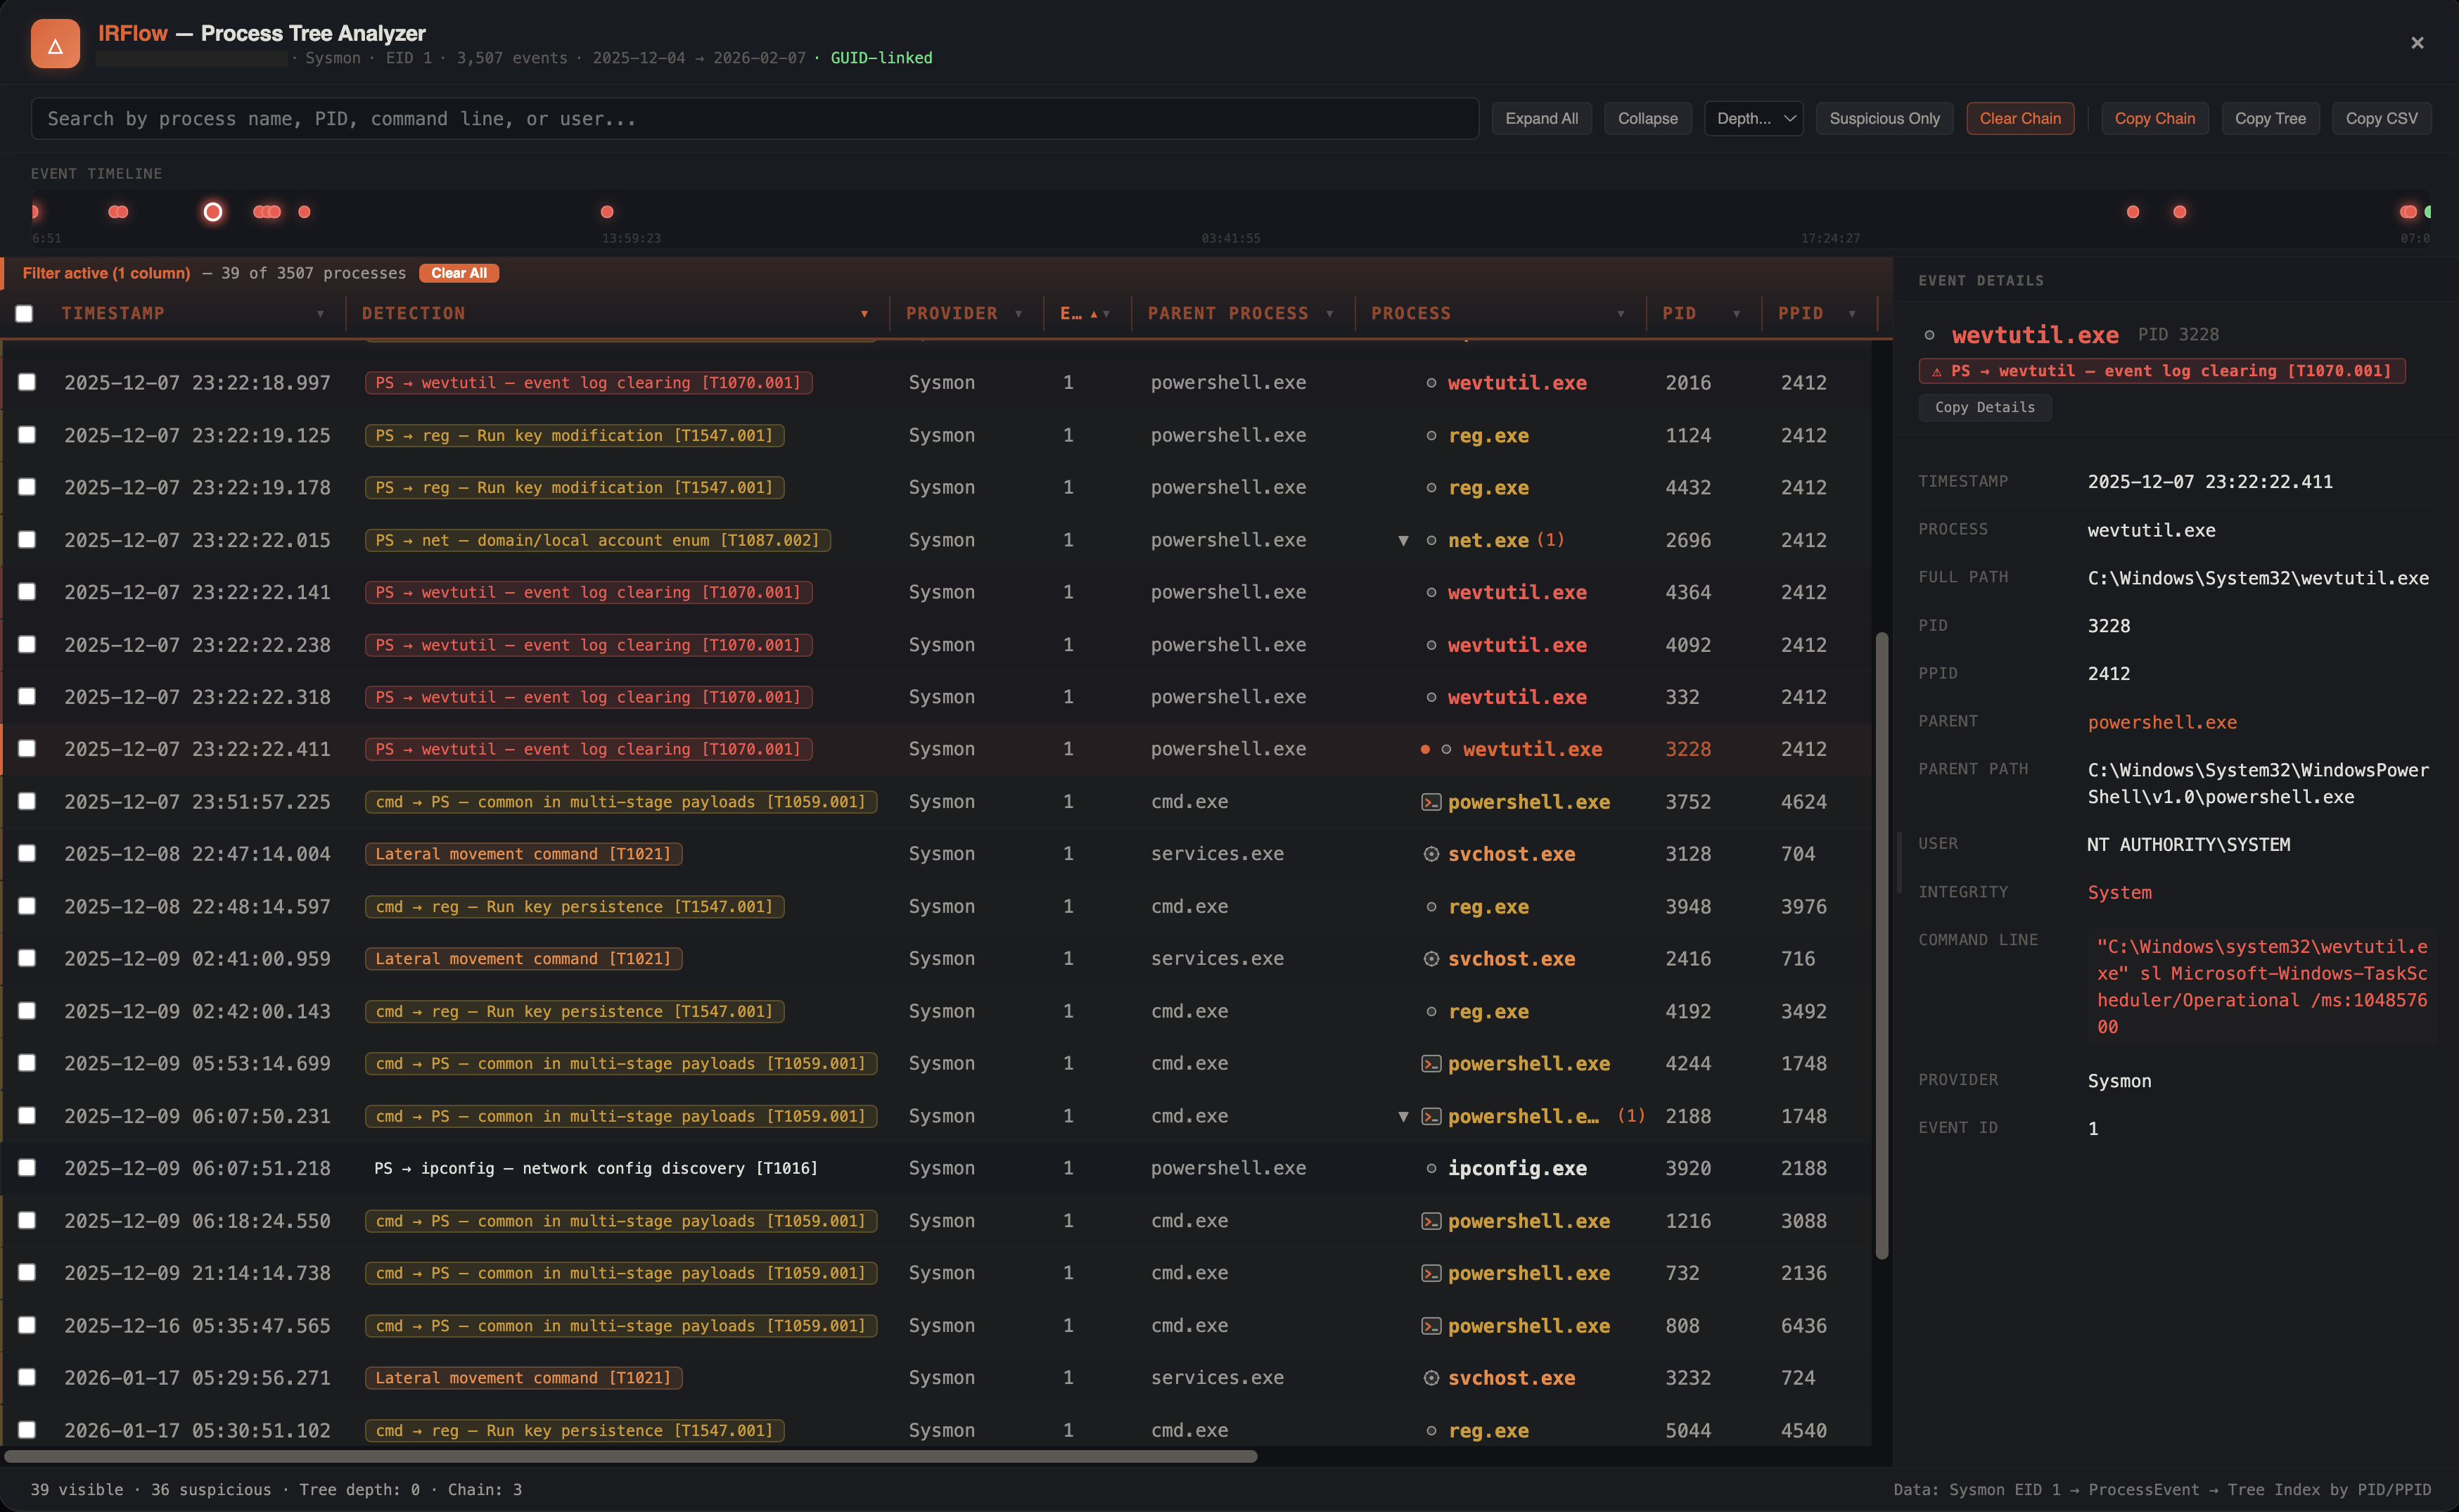
Process Inspector
The Process Inspector visualizes parent-child process relationships from Sysmon Event ID 1 and Windows Security Event ID 4688 (Process Create) logs, providing a hierarchical view of execution chains with automatic suspicious pattern detection and detailed process analysis.
Opening the Process Inspector
- Menu: Tools > Process Inspector
- Supports Sysmon Event ID 1 and Windows Security Event ID 4688 (from EVTX or CSV export)
- Default filter:
1,4688— both event IDs are queried automatically - Configurable max processes limit (default: 200,000)
How It Works
The Process Inspector builds a hierarchy by linking processes through their parent-child relationships:
- GUID-preferred linking — uses
ProcessGuidandParentProcessGuidwhen available, which correctly handles PID reuse (a common forensic challenge). A green "GUID-linked" badge appears in the header when GUIDs are used - PID-based re-linking — when GUIDs are not available, builds a
pid → [nodes]lookup and re-links parent-child relationships by matching PPIDs to PIDs. For each child, selects the best parent: the latest process with a matching PID whose timestamp is before the child's creation time - Root detection — processes without a known parent become root nodes
Security Event 4688 Support
Windows Security Event 4688 uses reversed PID semantics compared to Sysmon: ProcessId is the parent and NewProcessId is the child. The tree automatically detects 4688 format and maps NewProcessName to the image path, TargetUserName to the user, and TokenElevationType/MandatoryLabel to elevation and integrity fields.
Auto-Detected Columns
IRFlow Timeline automatically identifies the relevant columns from your data:
| Column | Purpose | Patterns Matched |
|---|---|---|
ProcessId | Process identifier | ProcessId, pid, process_id, NewProcessId |
ParentProcessId | Parent process identifier | ParentProcessId, ppid, parent_process_id, CreatorProcessId |
ProcessGuid | Unique GUID (Sysmon) | ProcessGuid, process_guid |
ParentProcessGuid | Parent GUID (Sysmon) | ParentProcessGuid, parent_process_guid |
Image | Executable path | Image, process_name, exe, FileName, ImagePath, NewProcessName |
ParentImage | Parent executable path | ParentImage, ParentProcessName |
CommandLine | Full command line | CommandLine, command_line, cmd, cmdline, ProcessCommandLine |
User | Account context | User, UserName, SubjectUserName, TargetUserName |
UtcTime | Timestamp | UtcTime, datetime, TimeCreated, timestamp |
EventID | Event identifier | EventID, event_id, eventid |
Provider | Log source | Provider, SourceName, Channel |
Hostname | Computer name | Computer, ComputerName, Hostname, MachineName |
Elevation | Token elevation type | TokenElevationType, Token_Elevation_Type |
Integrity | Mandatory integrity level | MandatoryLabel, Mandatory_Label, IntegrityLevel |
EvtxECmd Support
When working with EvtxECmd CSV output, the Process Inspector extracts real PID and GUID values from PayloadData1 and PayloadData5 fields. Hex PID values (e.g., 0x1a2c) are automatically converted to decimal. This is important because EvtxECmd records the logging service PID by default — the tree uses the extracted values for accurate hierarchy building.
Table Columns
The process tree table displays 11 columns:
| Column | Description |
|---|---|
| Timestamp | Event timestamp |
| Detection | Chain-based detection reason with MITRE ATT&CK ID (color-coded by severity) |
| Provider | Abbreviated log source (e.g., "Sysmon", "Security") |
| Event ID | Source event identifier |
| Parent Process | Parent executable name |
| Process | Executable name with process type icon and suspicious indicator |
| PID | Process identifier |
| PPID | Parent process identifier |
| User | Account context |
| Command Line | Full command line arguments |
| Integrity | Process integrity level |
All columns are sortable (click header to toggle). PID, PPID, and Event ID sort numerically; all others sort as text. Default sort is by Timestamp ascending.
Process Type Icons
Each process receives an icon based on its category:
| Icon | Processes |
|---|---|
| Folder | Explorer |
| Document | Office apps (Word, Excel, PowerPoint, Outlook, OneNote, Access, Acrobat) |
| Terminal | Shells (cmd, powershell, pwsh, bash, sh, conhost) |
| Gear | System services (svchost, services, lsass, csrss, smss, wininit, winlogon, spoolsv) |
| Globe | Browsers (chrome, firefox, msedge, iexplore, opera, brave, safari) |
| Circle | All other processes |
Integrity Levels
The integrity column decodes Windows mandatory integrity labels:
| Value | Label | Color |
|---|---|---|
| S-1-16-16384 | System | Red |
| S-1-16-12288 | High | Orange |
| S-1-16-8192 | Medium | Yellow |
| S-1-16-4096 | Low | Gray |
| S-1-16-0 | Untrusted | Purple |
Token elevation types are also decoded: %%1936 = Full (elevated), %%1937 = Limited (not elevated), %%1938 = Default.
Suspicious Pattern Detection
The Process Inspector uses a library of 342 parent-child chain rules mapped to MITRE ATT&CK techniques (src/detection-rules.js), plus 13 standalone regex patterns for command-line and path analysis. Chain rules are pre-indexed in a Map for O(1) lookup by parent:child pair. Each detection returns a human-readable reason string with ATT&CK technique ID displayed as a badge on the process node.
The detection rules cover 12 ATT&CK tactic categories: Execution, Defense Evasion/LOLBins, C2/RATs, Persistence, Discovery/Recon, Credential Access, Lateral Movement, Impact/Ransomware, Collection/Staging, Exfiltration, Initial Access (web shells), and Browser Exploits. A safe process exclusion list (SAFE_PROCS) prevents false positives on legitimate Windows processes that run from temp/AppData paths.
Critical (Red)
| Detection | Reason | Example |
|---|---|---|
| Office app spawning shell | "Office spawning shell" | WINWORD.EXE → cmd.exe |
| Web server spawning shell | "Webshell — shell from web server" | w3wp.exe → powershell.exe |
| Suspicious child of LSASS | "Suspicious child of LSASS" | lsass.exe → unknown.exe |
| Encoded PowerShell | "Encoded PowerShell" | powershell -enc ... |
| Remote execution tools | "Remote execution tool" | psexesvc.exe, wsmprovhost.exe |
| Credential dumping commands | "Credential dumping" | comsvcs.dll, sekurlsa, mimikatz |
| NTDS extraction | "NTDS extraction" | ntdsutil ifm, secretsdump |
| LSASS access tools | "LSASS access tool" | procdump, processhacker, handlekatz |
High (Orange)
| Detection | Reason | Example |
|---|---|---|
| LOLBin from unusual parent | "LOLBin — certutil.exe via cmd.exe" | explorer.exe is normal; mshta.exe is not |
| Svchost from unusual parent | "Svchost from unusual parent" | svchost.exe not under services.exe |
| Script from user profile | "Script from user profile" | wscript.exe running from \AppData\ |
| Reconnaissance via shell | "Reconnaissance — whoami" | cmd.exe → whoami.exe |
| Lateral movement commands | "Lateral movement command" | wmic /node:, winrm |
| Account manipulation | "Account manipulation" | net user /add, net localgroup /add |
| Defense evasion | "Defense evasion" | vssadmin delete, wevtutil cl |
| RMM tool from unusual parent | "RMM tool — unusual parent" | anydesk.exe not from explorer.exe |
| Exfiltration tools | "Exfiltration tool" | rclone, winscp, megasync |
| Suspicious archive operations | "Suspicious archive operation" | 7z a -p archive.7z |
| PsExec service from shell | "PsExec service from shell" | cmd.exe → psexesvc.exe |
| WMI lateral movement | "WMI lateral movement" | wmiprvse.exe → cmd.exe with ADMIN$ |
Medium (Yellow)
| Detection | Reason | Example |
|---|---|---|
| Suspicious execution path | "Suspicious path" | Running from \Temp\, \AppData\, \Downloads\, \ProgramData\ |
| Reconnaissance commands | "Reconnaissance — ipconfig" | ipconfig, systeminfo, tasklist without shell parent |
| Network scanners | "Network scanner" | netscan, masscan, nbtscan |
| AD recon tools | "AD recon tool" | sharphound, bloodhound, rubeus, certify |
| Remote management tools | "Remote management tool" | anydesk, teamviewer, screenconnect |
Detail Panel
Click any process to open a resizable right-side detail panel. The panel shows:
- Process header — process type icon, name, PID, and suspicious reason badge
- Field grid with up to 13 fields: Timestamp, Process, Full Path, PID, PPID, Parent (clickable — navigates to parent), Parent Path, User, Integrity (color-coded), Elevation, Command Line (red text), Provider, Event ID
- Children chips — clickable badges for up to 20 child processes, colored by suspicious level
Drag the left edge to resize the panel.
Loading Screen
While the tree is building, an animated loading screen shows a multi-phase progress indicator:
- Querying database...
- Parsing process events...
- Building parent-child relationships...
- Computing tree depth...
- Finalizing...
- Complete
A cancel button is available to abort long-running queries.
Navigation
Expand / Collapse
- Click the arrow next to any process to expand or collapse its children
- Use the depth limit control to set maximum visible tree depth
- Expand All / Collapse All buttons in the toolbar
- Suspicious only filter — shows only flagged processes in a flat (non-hierarchical) list sorted by timestamp, making it easy to review all detections without navigating the tree
Ancestor Chain Highlighting
Click any process node to highlight its full ancestor chain from root to the selected process. This shows the complete execution path that led to the selected process.
Filter to Process
Click the filter icon on a process node to filter the main data grid to rows matching that process's PID. This lets you see all events associated with a specific process.
Checkbox Selection
Each process row has a checkbox for multi-selection. Selected processes can be:
- Copy Selected — copies only the checked rows as tab-separated data to the clipboard
- Copy Tree — copies all visible processes (ignoring selection) as tab-separated data
Both copy operations include columns: Hostname, ParentProcessName, Provider, EventID, and all original process fields.
EvtxECmd Provider Filtering
When EvtxECmd data is detected, the Process Inspector automatically filters by Sysmon and Security providers using the Provider column. This ensures only process creation events are included, excluding noise from other event sources that share the same Event IDs.
Footer
The footer bar displays:
- Left: Visible process count, suspicious count, tree depth, and chain size (when a node is selected)
- Right: Data pipeline description showing providers, event IDs, and linking method
Modal Header
The header displays contextual information about the loaded data:
- Hostname (from process data or user domain prefix)
- Provider names (abbreviated: "Microsoft-Windows-Sysmon" → "Sysmon")
- Event IDs included
- Total event count
- Date range of the data
- GUID-linked badge (green) when GUID linking is active
- Truncated warning (red) when the max process limit was reached
Tips
Sysmon Configuration
For best results, ensure Sysmon is configured to log Event ID 1 (Process Create) with command line logging enabled. The more data available, the richer the analysis.
Large Datasets
For datasets with thousands of processes, use the depth limit control to start with a shallow view (depth 3-4) and expand specific branches of interest. The default max processes limit is 200,000.
Combine with Persistence Analyzer
After identifying a suspicious persistence mechanism, use the Process Inspector to trace what process installed it and what the persisted binary spawns on execution.