Histogram
The histogram provides a visual timeline of event distribution, helping you identify activity patterns, quiet periods, and suspicious bursts at a glance.
Opening the Histogram
- Click the Histogram button in the main toolbar
- The histogram panel appears above the data grid and can be resized by dragging its bottom edge (80px–500px range, default 160px)
Granularity
Choose the time bucketing level from the histogram toolbar:
| Granularity | Bucket Size | Best For |
|---|---|---|
| Day | 1 calendar day | Long timelines (weeks/months) |
| Hour | 1 hour | Multi-day investigations |
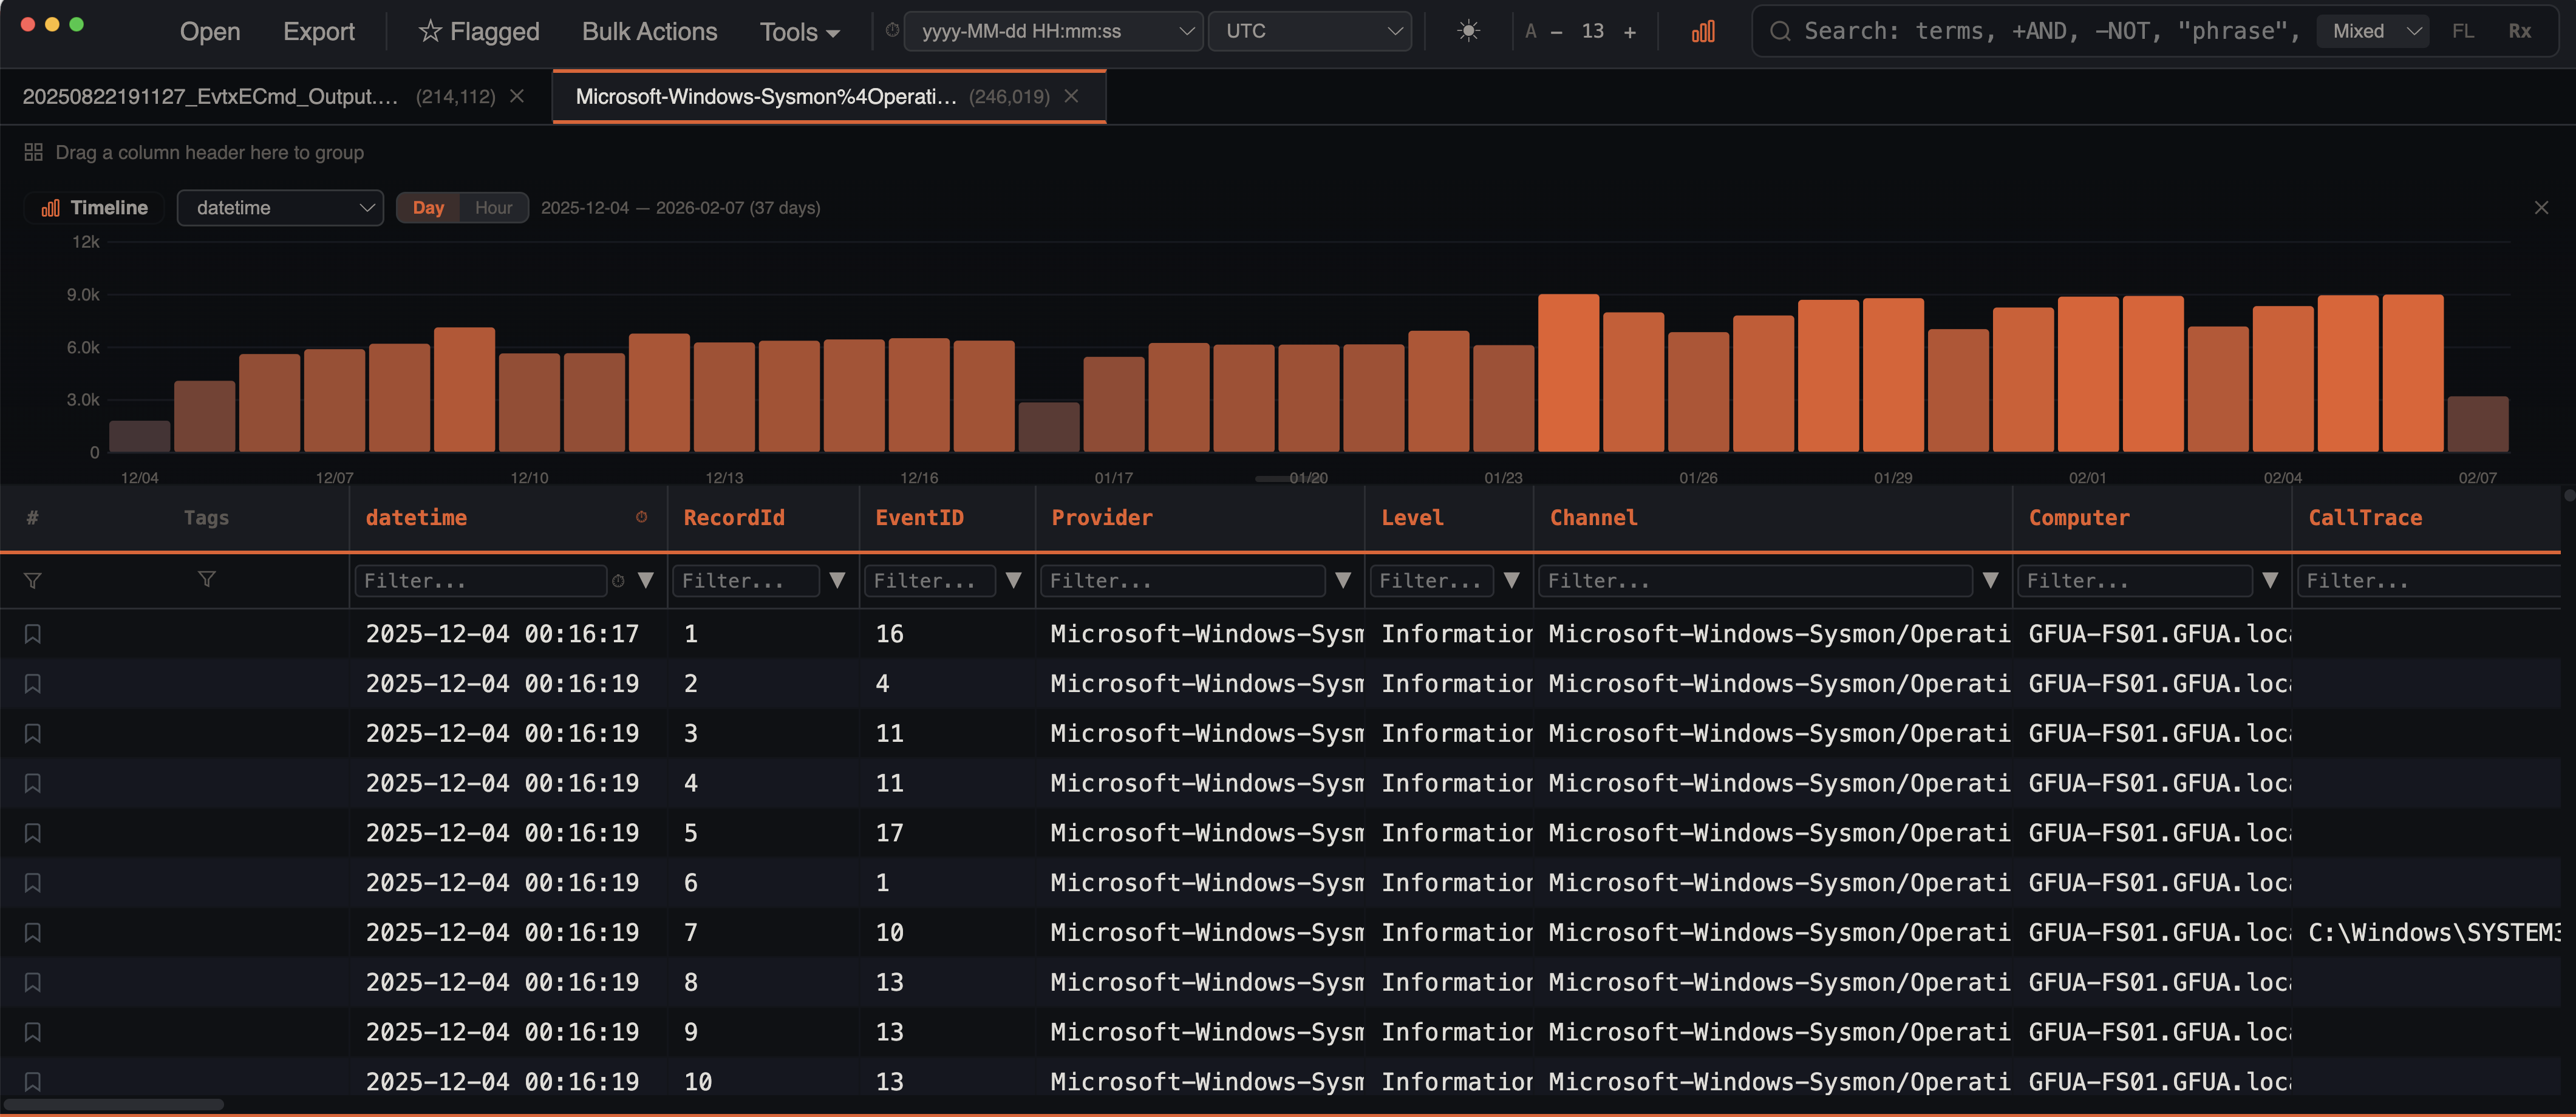
A date range label displays the full span and bucket count (e.g., 2024-01-15 — 2024-02-20 (37 days)).
Heatmap Coloring
Bar height represents event count and bars are colored using a heatmap gradient based on event density:
- Low activity — dark teal/blue
- High activity — orange
The color intensity scales linearly from the minimum to maximum event count across all buckets, making spikes immediately visible.
Brush Selection
Click and drag on the histogram to select a time range:
- A translucent accent overlay with dashed border highlights the selected range
- The date range is displayed above the brush selection
- On release, the data grid immediately filters to show only events within that range via date range filters
- Click outside the brush or clear filters to restore the full view
The brush uses direct DOM positioning during drag — overlay and label elements update without triggering React re-renders, so selection stays smooth even on histograms with thousands of bars.
This is the fastest way to zoom into a specific activity window.
Timestamp Format Support
The histogram's date extraction engine handles a wide range of timestamp formats:
| Format | Example |
|---|---|
| ISO 8601 | 2024-01-15T14:30:00Z |
| US date (M/D/YYYY) | 01/15/2024 or 1/15/2024 |
| Month name | Feb 5th 2026, February 5, 2026, 5 Feb 2026 |
| Unix seconds | 1706360000 (10 digits) |
| Unix milliseconds | 1706360000000 (13 digits) |
| Excel serial dates | 45566 → 2024-10-05 (range 1–73050, covering 1900–2100) |
| 12-hour with AM/PM | 01/15/2024 2:30:00 PM |
Filter Awareness
The histogram respects all active filters:
- Column filters
- Checkbox filters
- Date range filters
- Search terms and mode
- Advanced filters
- Bookmark filter
When filters are active, the histogram shows the distribution of filtered rows only and bars within the active date range are highlighted in the warning color (orange).
Column Selector
If multiple timestamp columns exist in your data, a dropdown in the histogram toolbar lets you select which one to use. The histogram re-fetches data when you switch columns.
Per-Tab Caching
Histogram data is cached per tab using a composite signature that includes the tab ID, selected column, granularity, total filtered count, search terms, bookmark state, date range filters, and advanced filters. When switching between tabs, the histogram updates instantly from cache. Stale cached data is shown while a refresh query runs in the background with a 400ms debounce.
Multi-Source Coloring
When viewing merged timelines or files with multiple artifact types, the histogram bars are color-coded by source. Each artifact type or log channel gets a distinct color, making it easy to see which sources contributed events at each time period.
Stacking Glassmorphism
When multiple event sources overlap in the same time bucket, bars stack with a subtle transparency effect using backdrop blur. This lets you see the composition of each time bucket without sources hiding behind each other. The histogram panel itself uses a glassmorphism effect with 8px blur.
Bar Tooltips
Hovering over any bar displays a tooltip showing the exact date/hour and event count (e.g., 2024-01-15: 1,234 events). The bar brightens on hover for visual feedback.
X-Axis Label Spacing
Labels are automatically spaced to avoid overlap — approximately every 70px for day view and 90px for hour view. The first and last buckets always show labels. Day labels use MM/DD format, hour labels use MM/DD HH:00.