Lateral Movement Tracker
The Lateral Movement Tracker visualizes network logon activity across your environment as an interactive force-directed graph, with built-in RDP session correlation, detection rules, and multi-hop chain reconstruction to help you detect and trace attacker movement between systems.
Opening the Tracker
- Menu: Tools > Lateral Movement Tracker
- Supports 16 event IDs across Windows Security, TerminalServices, and RDP logs
Detection Rules
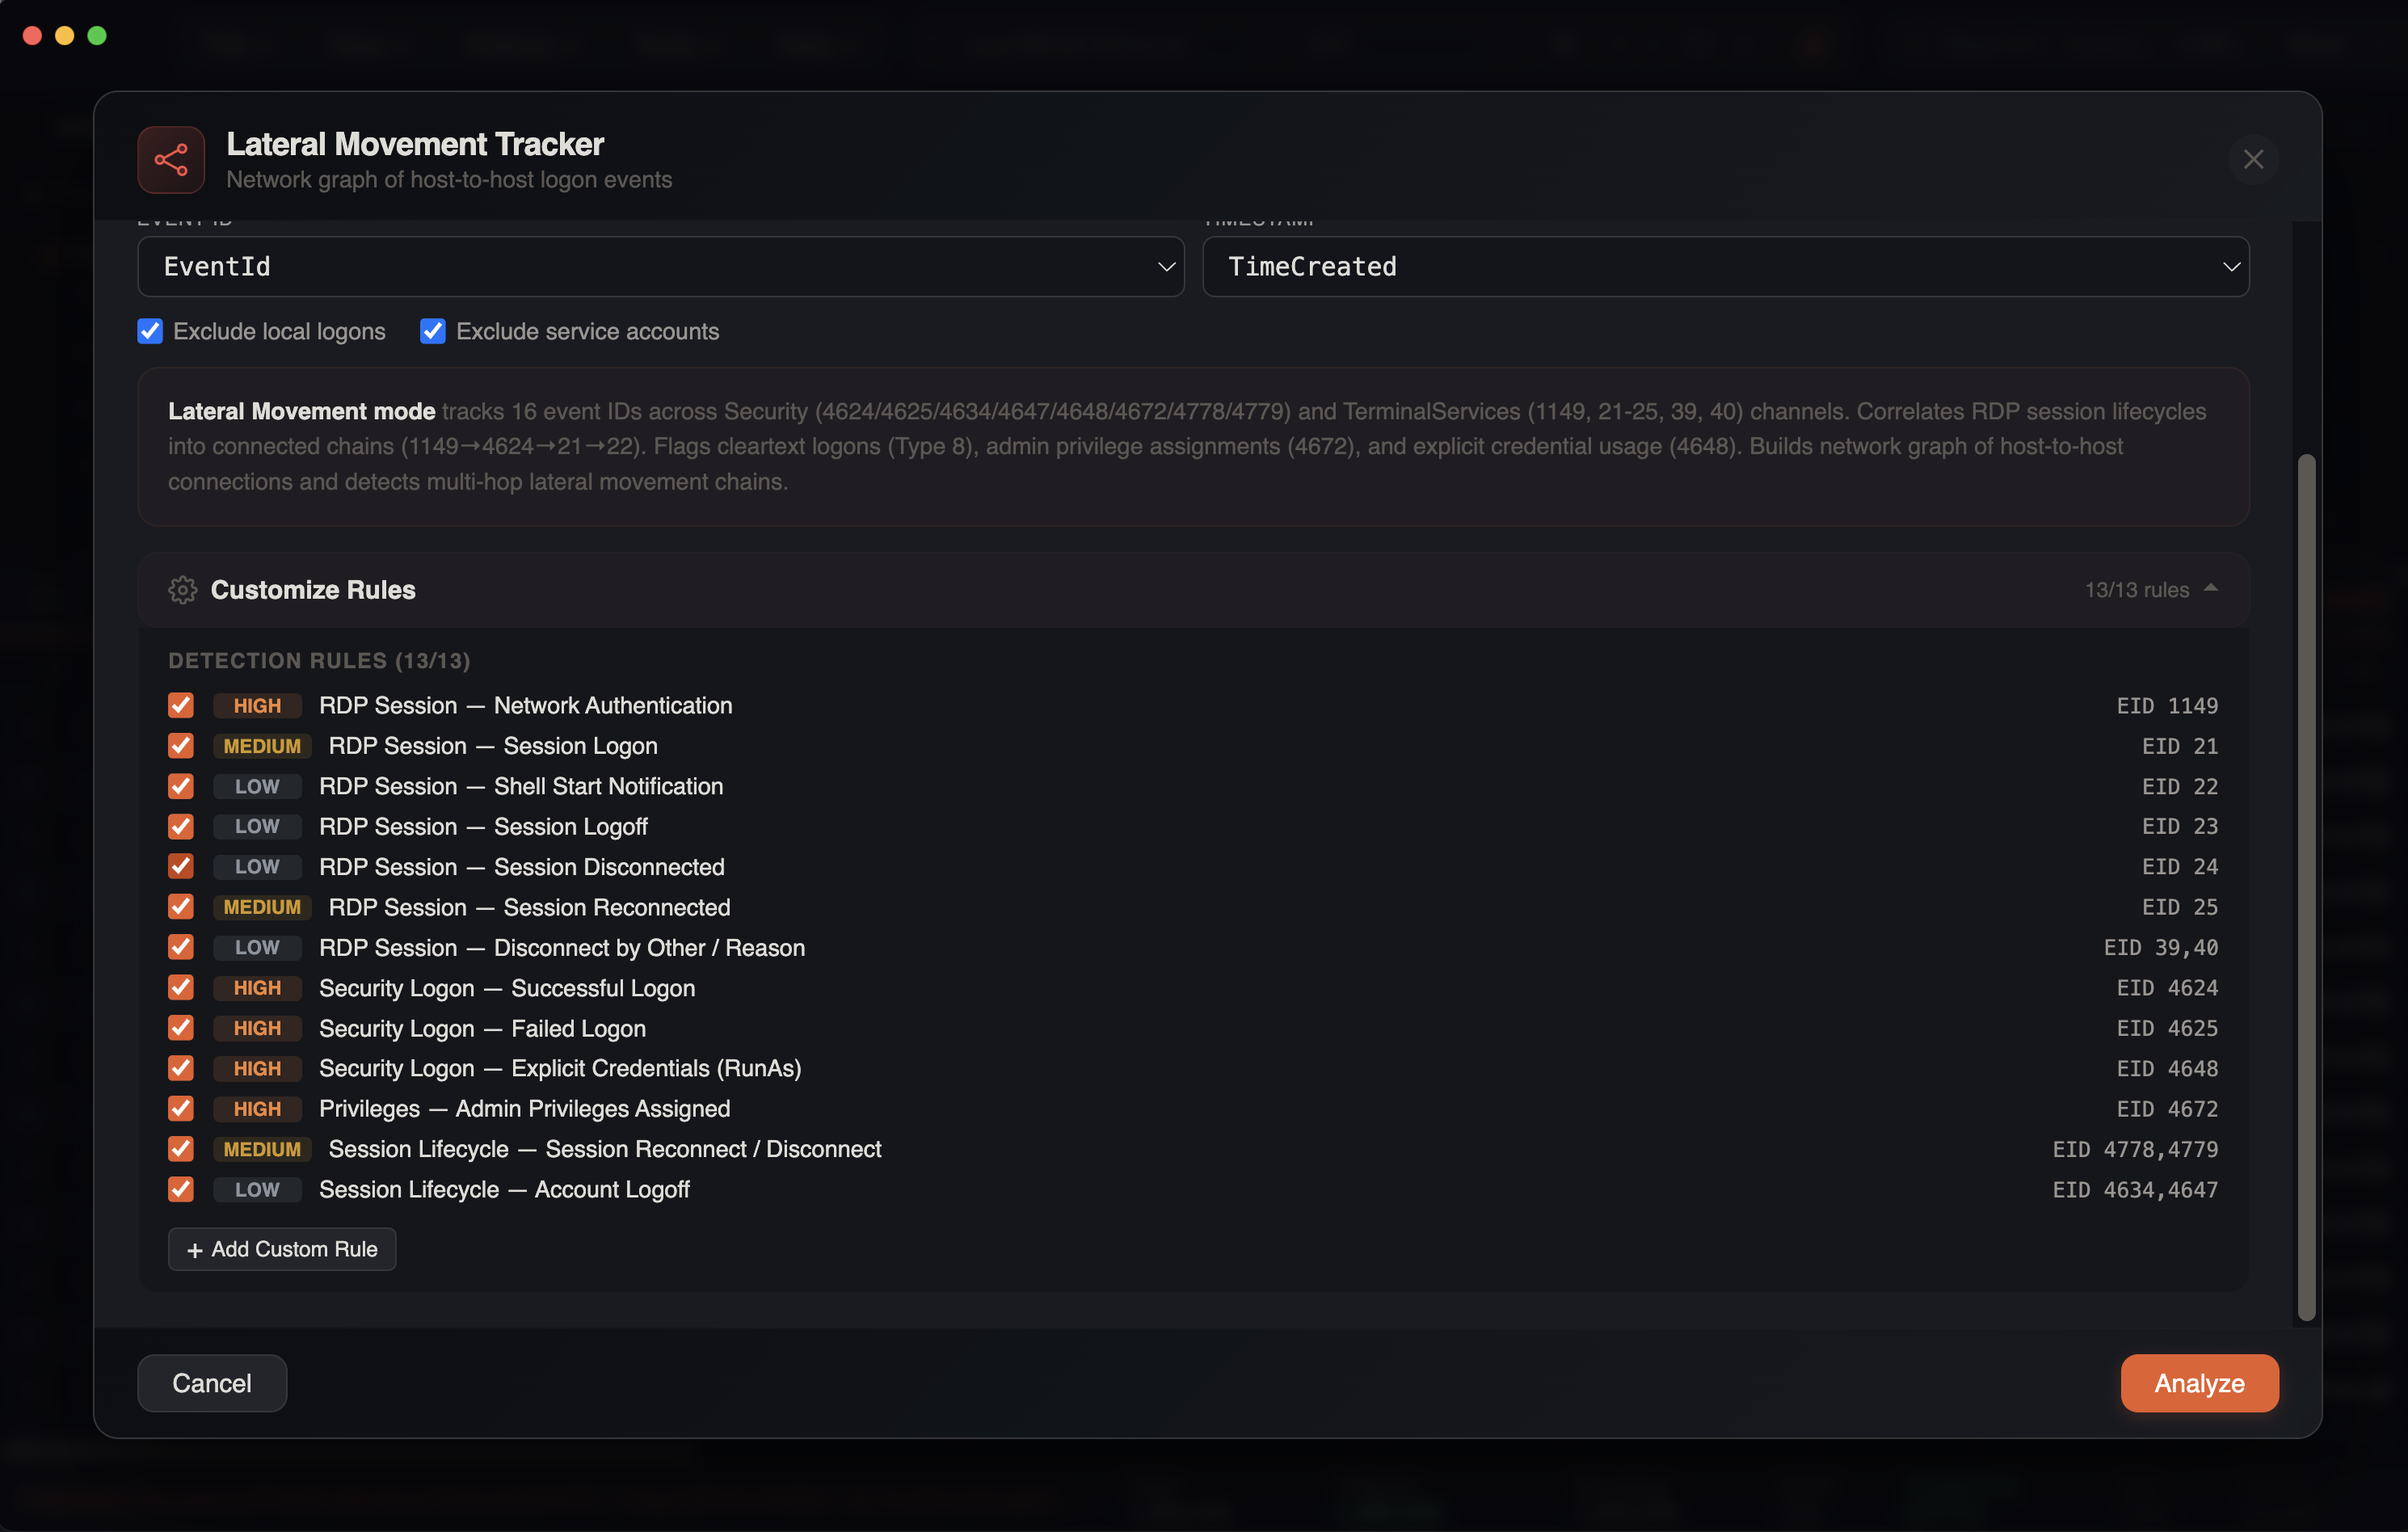
The tracker uses a configurable rules system with 13 built-in detection rules across four categories. Each rule can be individually toggled on or off.
RDP Session Rules
| Rule | Event IDs | Severity | Source |
|---|---|---|---|
| Network Authentication | 1149 | High | RemoteConnectionManager |
| Session Logon | 21 | Medium | LocalSessionManager |
| Shell Start Notification | 22 | Low | LocalSessionManager |
| Session Logoff | 23 | Low | LocalSessionManager |
| Session Disconnected | 24 | Low | LocalSessionManager |
| Session Reconnected | 25 | Medium | LocalSessionManager |
| Disconnect by Other / Reason | 39, 40 | Low | LocalSessionManager |
Security Logon Rules
| Rule | Event IDs | Severity | Hint |
|---|---|---|---|
| Successful Logon | 4624 | High | Types 2,3,7,8,9,10,11,12 |
| Failed Logon | 4625 | High | All logon types |
| Explicit Credentials (RunAs) | 4648 | High | Alternate credential usage |
Privilege Rules
| Rule | Event IDs | Severity | Hint |
|---|---|---|---|
| Admin Privileges Assigned | 4672 | High | Special privileges at logon |
Session Lifecycle Rules
| Rule | Event IDs | Severity | Hint |
|---|---|---|---|
| Session Reconnect / Disconnect | 4778, 4779 | Medium | Window Station events |
| Account Logoff | 4634, 4647 | Low | Logoff / user-initiated logoff |
Custom Rules
You can add custom detection rules with:
- Category — grouping label
- Rule Name — descriptive name
- Event IDs — comma-separated list
- Severity — critical, high, medium, or low
- Payload Regex Filter — optional regex to filter on payload content
Custom rules are merged with built-in rules. Event IDs for scanning are dynamically computed from all enabled rules.
Severity Colors
| Level | Color |
|---|---|
| Critical | Red |
| High | Orange |
| Medium | Yellow |
| Low | Gray |
Auto-Detected Columns
The tracker automatically identifies relevant columns:
| Column | Patterns Matched |
|---|---|
| Source IP | IpAddress, SourceNetworkAddress, SourceAddress, RemoteHost |
| Workstation | WorkstationName, SourceHostname, SourceComputerName |
| Target | Computer, ComputerName, Hostname |
| User | TargetUserName, UserName, (EvtxECmd: PayloadData1) |
| Logon Type | LogonType, Logon_Type, (EvtxECmd: PayloadData2) |
| Event ID | EventID, event_id, eventid |
| Timestamp | datetime, UtcTime, TimeCreated, timestamp |
| Domain | TargetDomainName, SubjectDomainName |
| Client Name | ClientName, Client_Name |
| Client Address | ClientAddress, Client_Address, ClientIP |
| Channel | Channel, SourceName, Provider |
EvtxECmd Support
For EvtxECmd CSV output, the tracker parses RemoteHost (format: WorkstationName (IP)), and PayloadData1/PayloadData2/PayloadData3 fields for TerminalServices event parsing.
TerminalServices Event Parsing
The tracker includes dedicated parsing for TerminalServices log channels:
- LocalSessionManager (EIDs 21–25, 39, 40) — extracts user from
PayloadData1(User: DOMAIN\Userformat), session ID fromPayloadData2, and source network address fromPayloadData3 - RemoteConnectionManager (EID 1149) — extracts user and source network address from
PayloadData1/PayloadData3
Channel detection uses the Channel column value to route events to the correct parser.
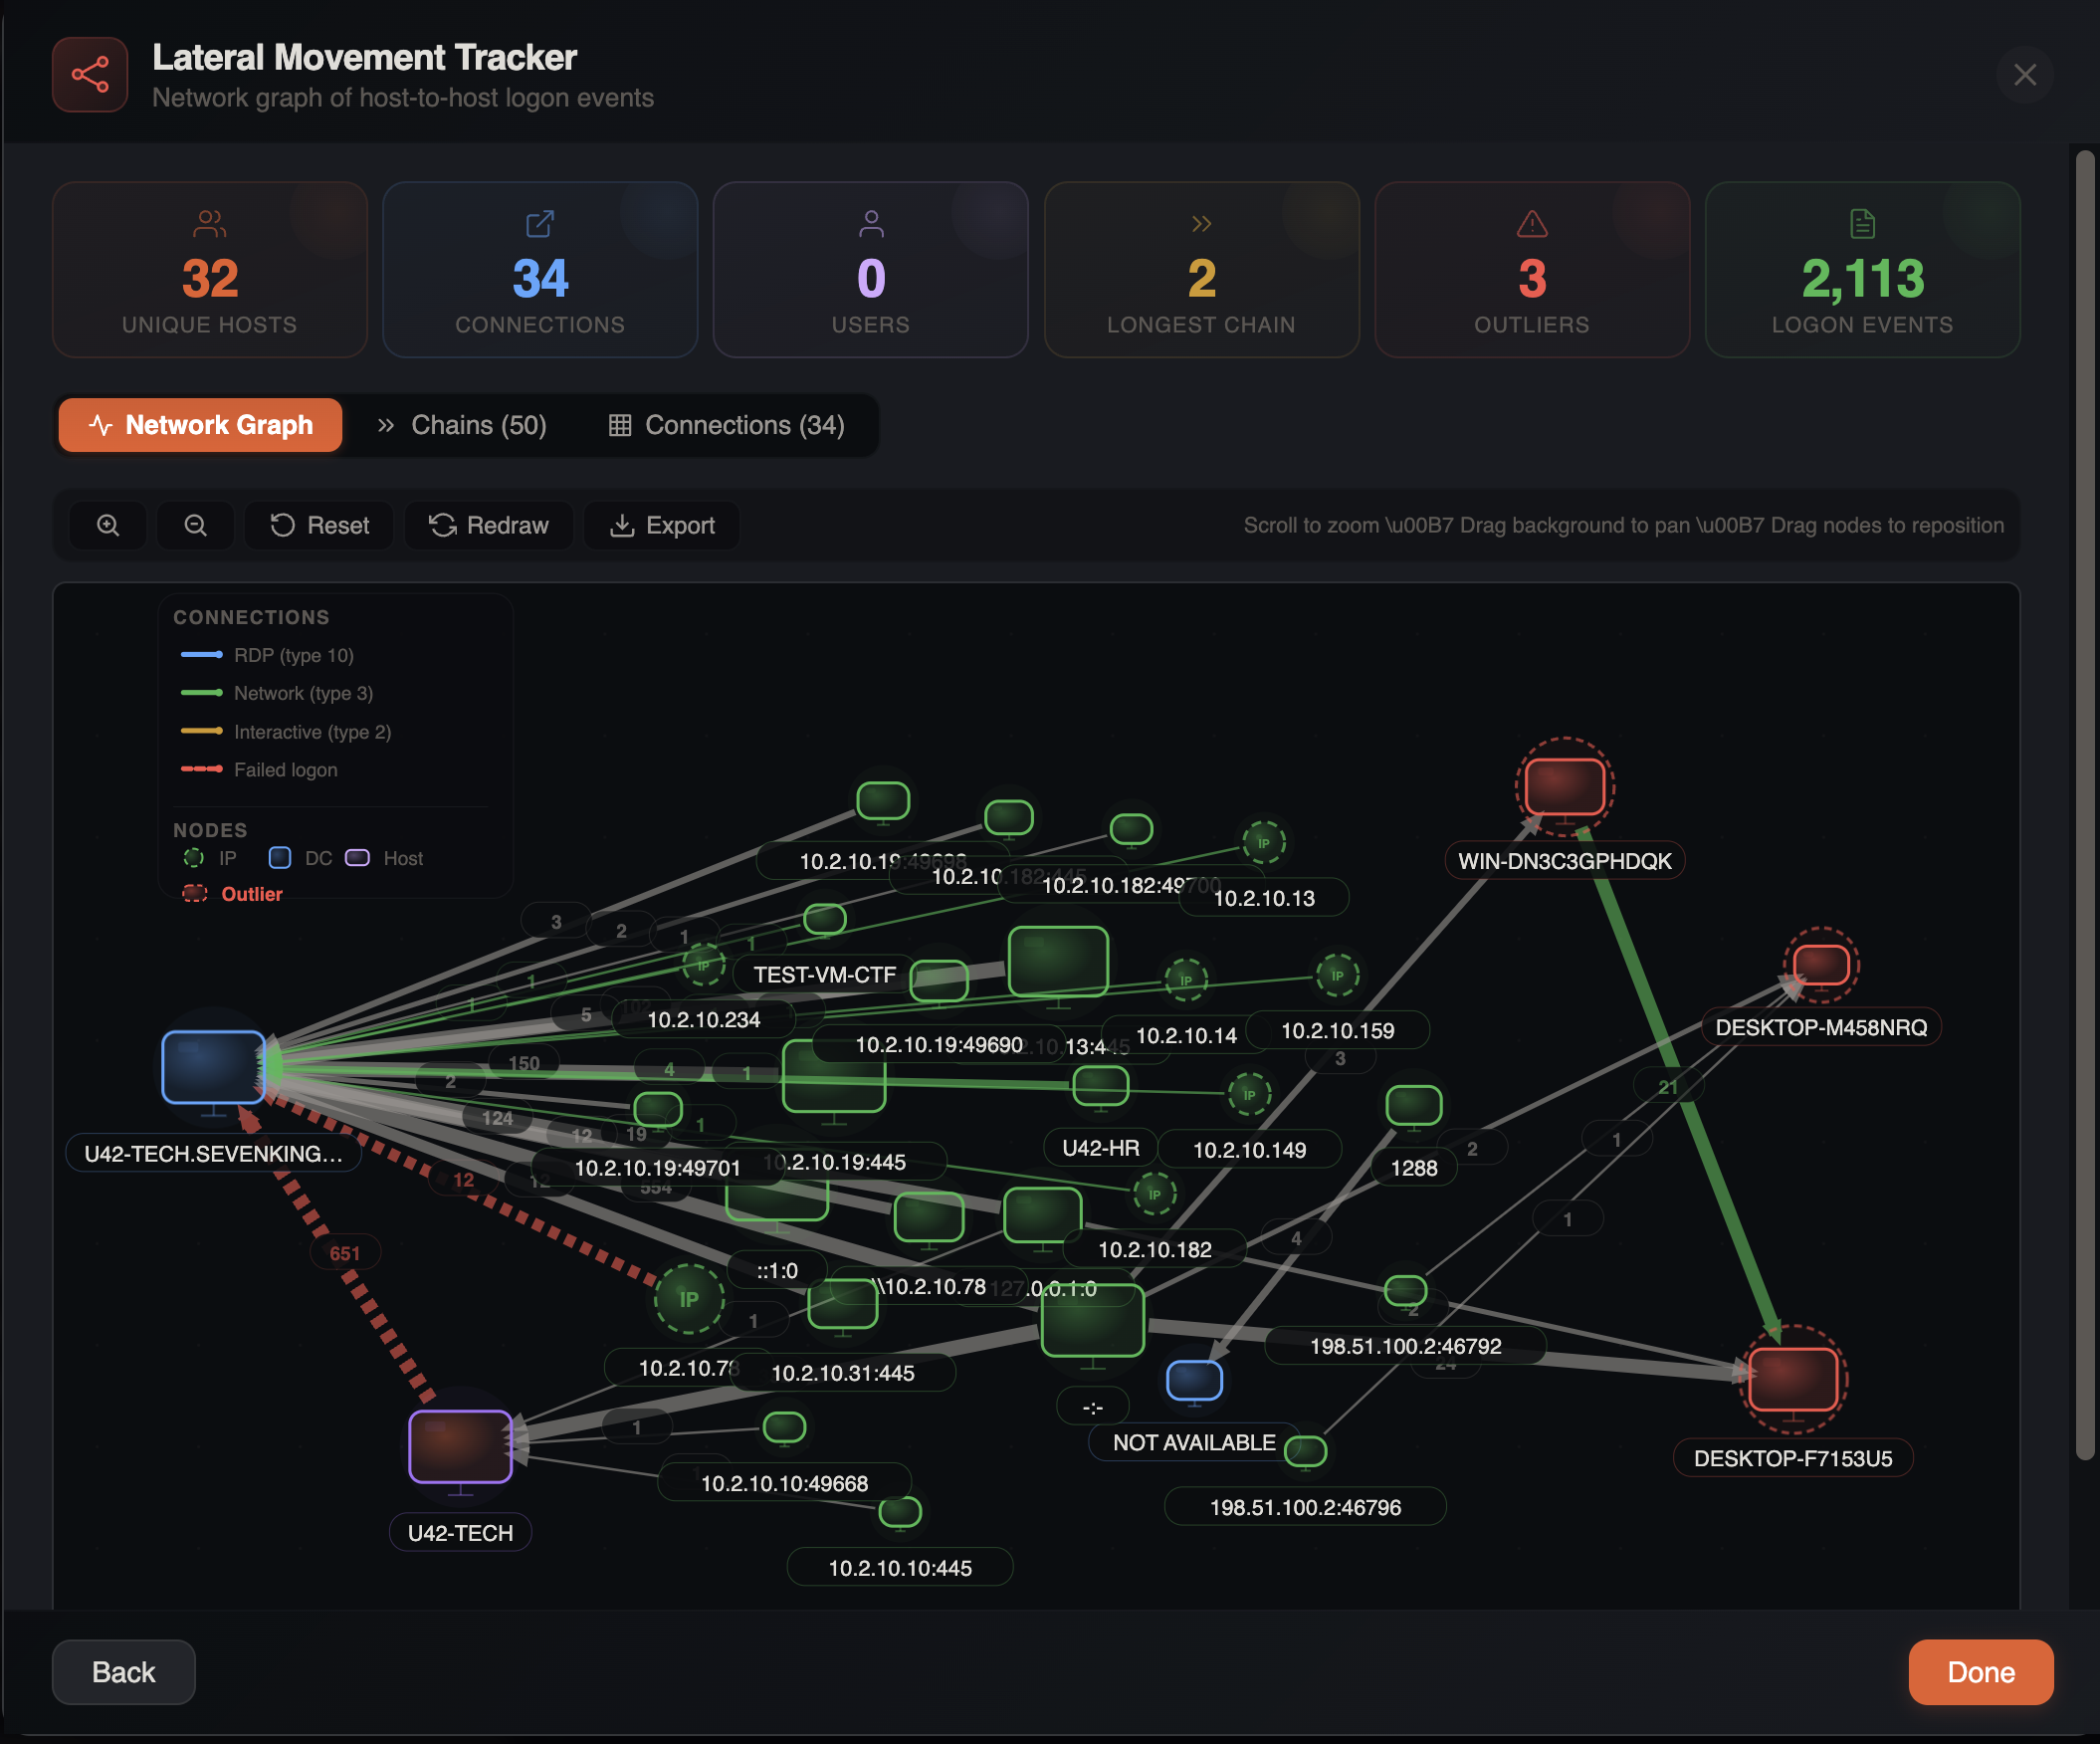
Stats Cards
Eight summary cards are displayed at the top of the modal:
| Metric | Color | Description |
|---|---|---|
| Findings | Red/Orange | Attack pattern detections (clickable — opens Findings tab). Red if critical findings exist |
| Unique Hosts | Orange | Total distinct hosts in the graph |
| Connections | Blue | Unique source→target pairs |
| Users | Purple | Distinct user accounts |
| RDP Sessions | Blue | Correlated RDP sessions |
| Longest Chain | Yellow | Deepest multi-hop path |
| Outliers | Red | Flagged suspicious hostnames (clickable — zooms to first outlier) |
| Logon Events | Green | Total events analyzed |
Network Graph
The primary view is an interactive SVG force-directed graph.
Node Types
| Shape | Type | Description |
|---|---|---|
| Dashed circle | IP Address | Source hosts identified by IP |
| Square | Domain Controller | Servers identified as DCs |
| Rounded rectangle | Workstation | Client machines |
Edge Styling
Connections between nodes indicate logon activity:
- Directional arrows — show the direction of the logon (source → target)
- Count labels — number of logon events between two nodes
- Color-coded by logon type:
| Color | Logon Type | Description |
|---|---|---|
| Blue | Type 10, 12 | RDP / Cached RDP |
| Green | Type 3 | Network logon (SMB, etc.) |
| Amber | Type 2 | Interactive logon |
| Purple | Type 7, 13 | Unlock / Cached Unlock |
| Orange | Type 9 | RunAs (explicit credentials) |
| Gray | Type 5 | Service logon |
| Red | Type 8 | Network Cleartext (dangerous) |
| Red dashed | — | Failed logon |
Edge Detail Panel
Click an edge to see a detailed breakdown:
- Source and target badges — highlighted in orange when a suspicious host is involved
- Event count, users, logon type with color coding
- CLEARTEXT badge — red warning when logon type 8 (cleartext credentials over the network) is present
- First seen / Last seen timestamps
- Event breakdown — pill-shaped chips showing count per event ID (e.g.,
4624 ×47,1149 ×12)
Draggable Legend
The graph legend is draggable — click and drag to reposition it. It shows all connection types (RDP, Network, Interactive, RunAs, Service, Cleartext, Failed) and node types (IP, DC, Host, Outlier, Suspicious Host).
Toolbar Controls
- Zoom in / out — adjust the view scale
- Pan — click and drag the background to pan
- Reset view — return to default zoom and position
- Redraw — re-run the force layout algorithm
- Find Flagged — cycle through outlier/suspicious hosts (appears when flagged hosts exist)
Five Sub-Tabs
1. Network Graph
The interactive force-directed visualization described above.
2. Findings
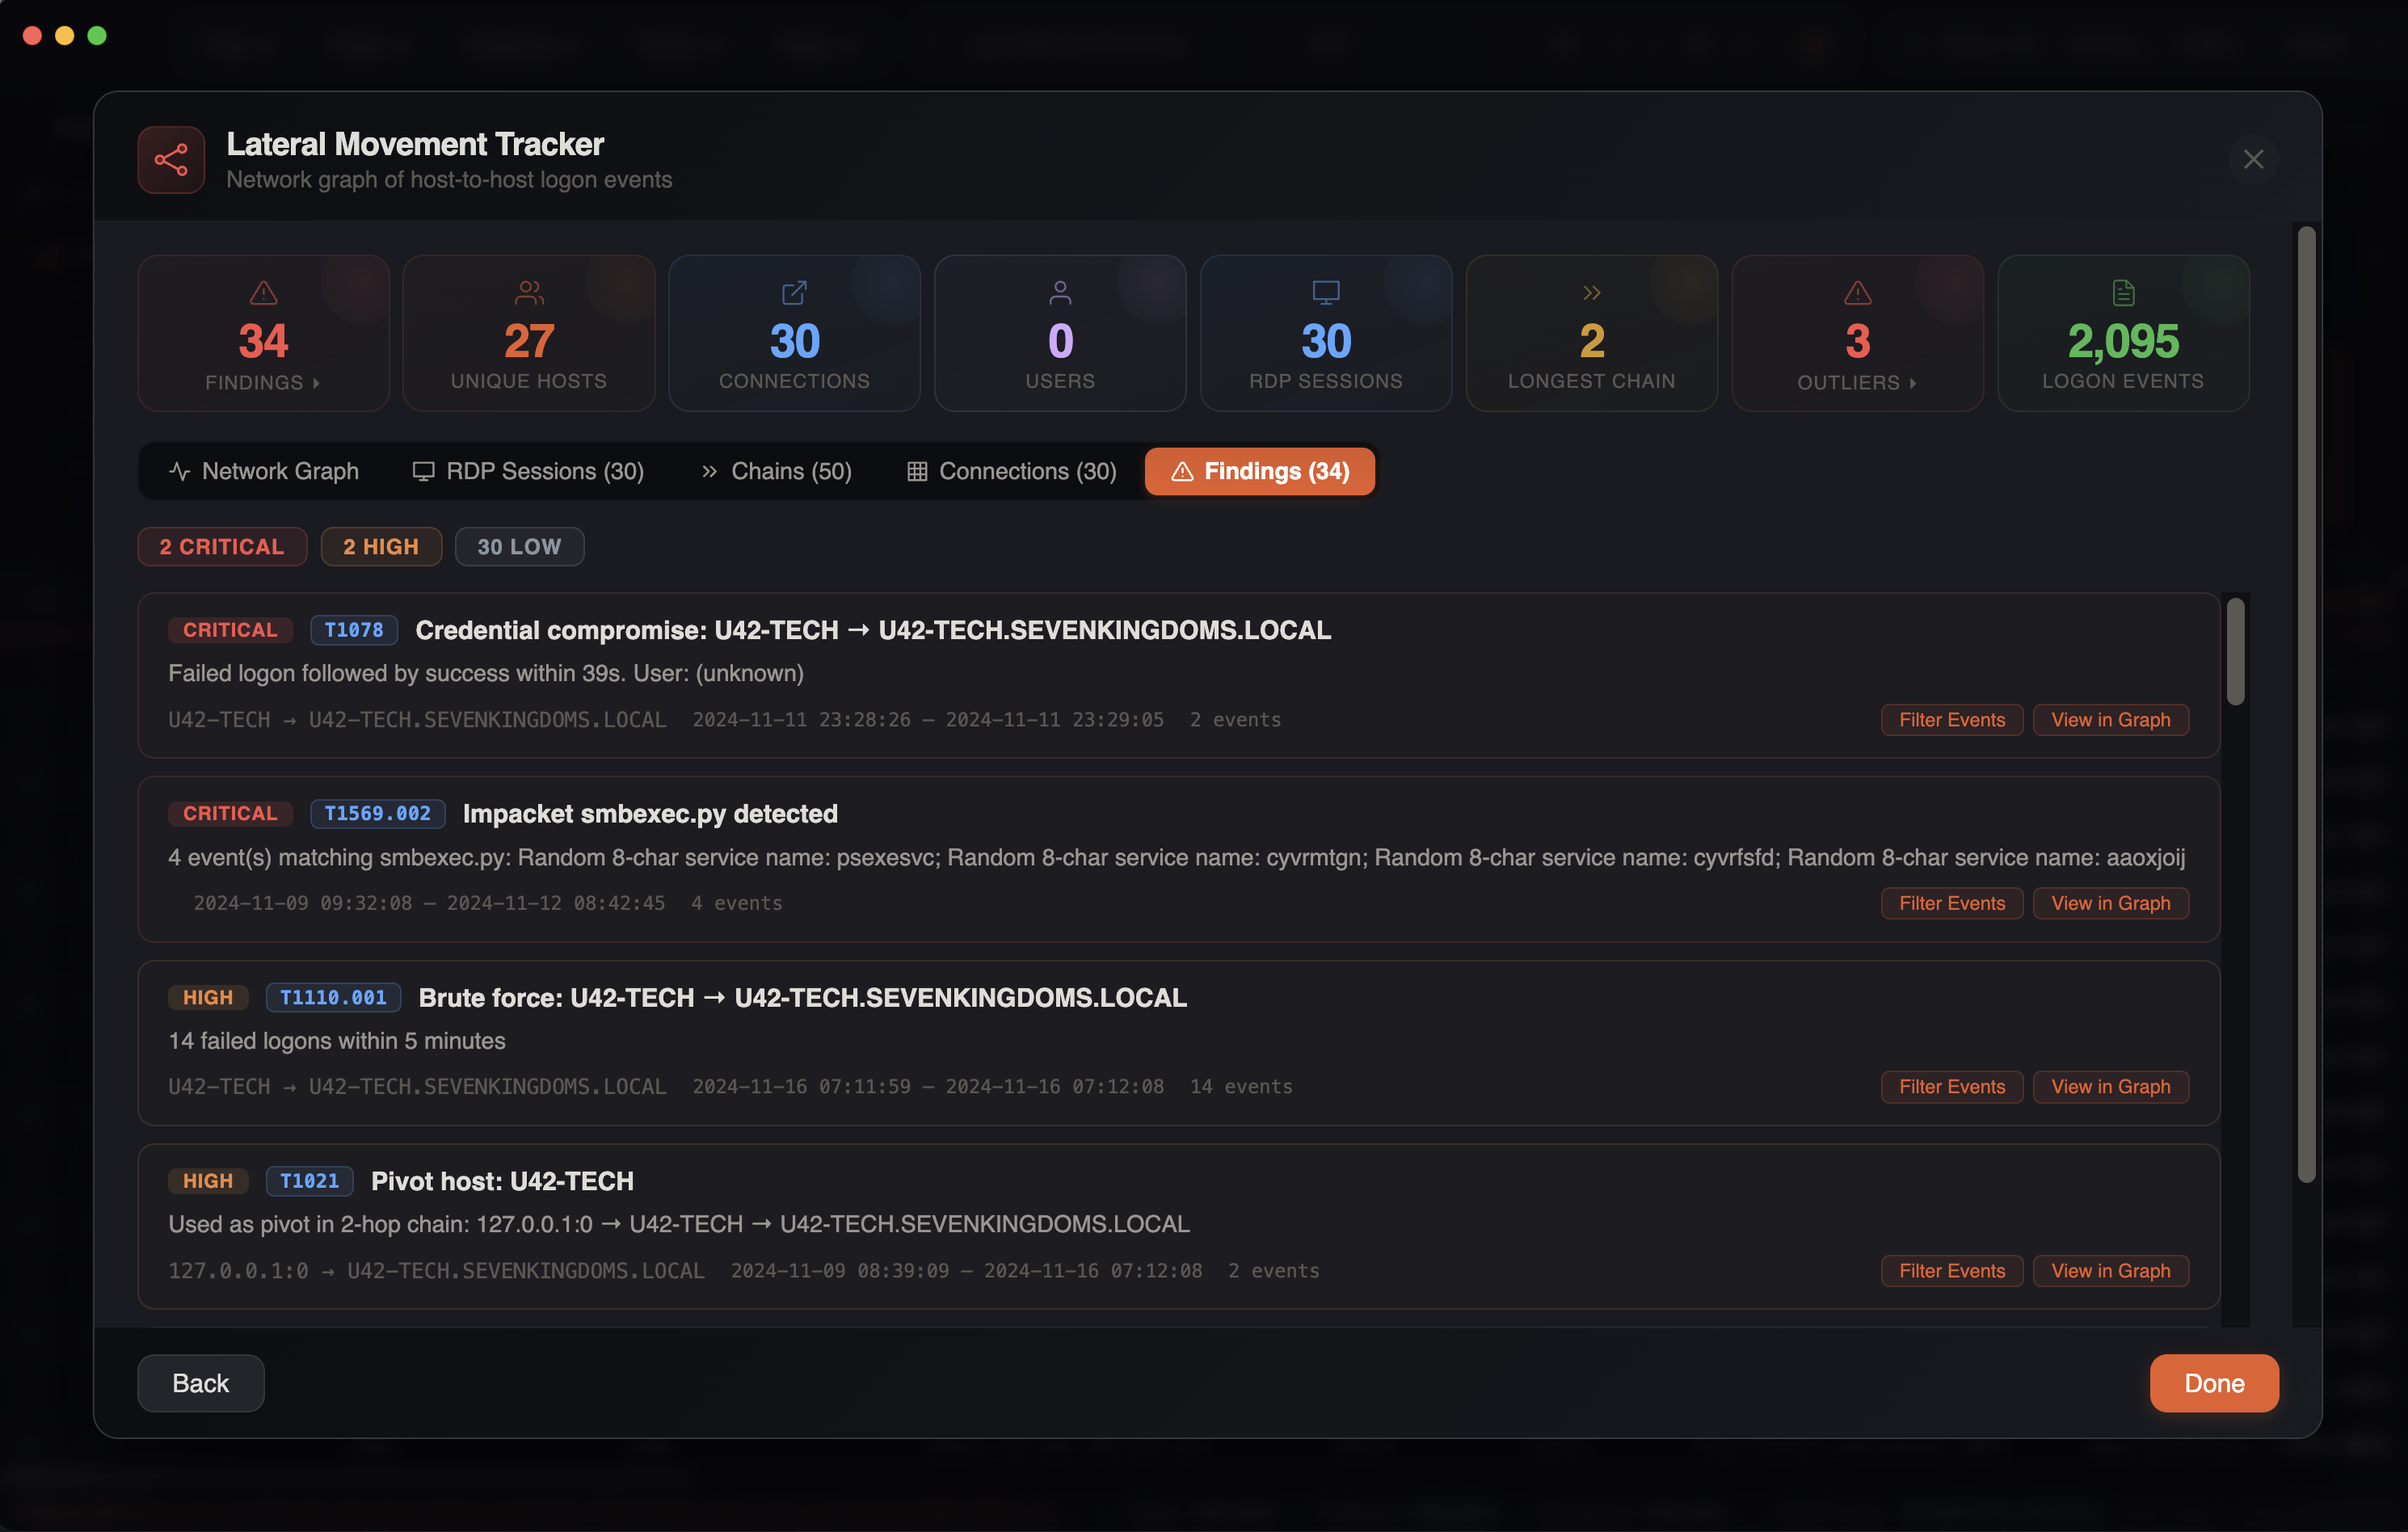
The Findings tab displays automated attack pattern detections with MITRE ATT&CK mapping. Each finding is a card showing severity, MITRE technique badge (clickable — links to attack.mitre.org), title, description, source/target hosts, time range, and event count.
Attack pattern detections:
| Detection | MITRE ID | Severity | Trigger |
|---|---|---|---|
| Brute Force | T1110.001 | High | 5+ failed logons (4625) from same source to same target within 5 minutes |
| Password Spray | T1110.003 | High | Same source fails against 3+ different targets within 30 minutes |
| Credential Compromise | T1078 | Critical | Failed logon (4625) followed by successful logon (4624) from same source to same target within 10 minutes |
| Impacket Execution | T1569.002 | Critical | 11 detection patterns across 5 Impacket variants (see below) |
| RMM Tool Detection | T1219 | High | 30 remote monitoring tools detected in process/service events |
| Lateral Pivot | T1021 | High | Host identified as middle node in multi-hop lateral movement chain |
| First Seen Connection | T1021 | Low | Connection is within the first 1% of the timeline or is the first connection from a source host |
Impacket Detection
The Impacket detection engine scans process creation (EID 4688/1), service installation (EID 7045/4697), and scheduled task (EID 4698) events for signatures of 5 Impacket tools:
| Variant | Key Indicators |
|---|---|
| smbexec.py | cmd.exe /Q /c with \\127.0.0.1\ADMIN$ redirect, __output pattern, %COMSPEC% with .bat chains, legacy service name BTOBTO |
| wmiexec.py | wmiprvse.exe spawning cmd.exe /Q, \\127.0.0.1\ADMIN$ output redirect |
| dcomexec.py | mmc.exe -Embedding (DCOM execution) |
| atexec.py | Output to \Temp\*.tmp with redirect, hardcoded StartBoundary 2015-07-15T20:35:13 |
| psexec.py | RemCom named pipes (remcom_communicat, remcom_stdin/stdout/stderr), random 4-char service names, service binary using command interpreter |
Service-based detections (EID 7045/4697) also flag random service names — 4-character names (psexec.py pattern) and 7-character names (smbexec.py pattern) — with a common English word exclusion list to reduce false positives.
RMM Tool Detection
Scans process and service events for 30 remote monitoring and management tools commonly abused in intrusions:
ConnectWise ScreenConnect, AnyDesk, TeamViewer, Atera, NetSupport Manager, Splashtop, RustDesk, PDQ Connect, MeshAgent/MeshCentral, Action1, Ammyy Admin, Remote Utilities, SimpleHelp, TacticalRMM, FleetDeck, Level.io, DWService, ngrok, ISL Online, HopToDesk, Lite Manager, UltraVNC, TigerVNC, RAdmin, Zoho Assist, Pulseway, LabTech/Automate, Tailscale, Kaseya VSA, N-able/SolarWinds
Finding Actions
Each finding card has two action buttons:
- Filter Events — closes the modal and applies targeted filters to the main grid: sets a checkbox filter on Event ID with relevant IDs for the finding category, sets a date range filter padded +/-5 minutes around the finding's time range, and clears other filters to avoid interference
- View in Graph — switches to the Graph tab and zooms/selects the relevant edge
3. Chains
Detected lateral movement chains showing multi-hop paths:
Host A → Host B → Host C → Host DThe chain detection algorithm uses depth-first search to trace connected logon sequences, identifying potential attacker movement paths through the network. Each chain shows first seen and last seen timestamps per connection.
4. RDP Sessions
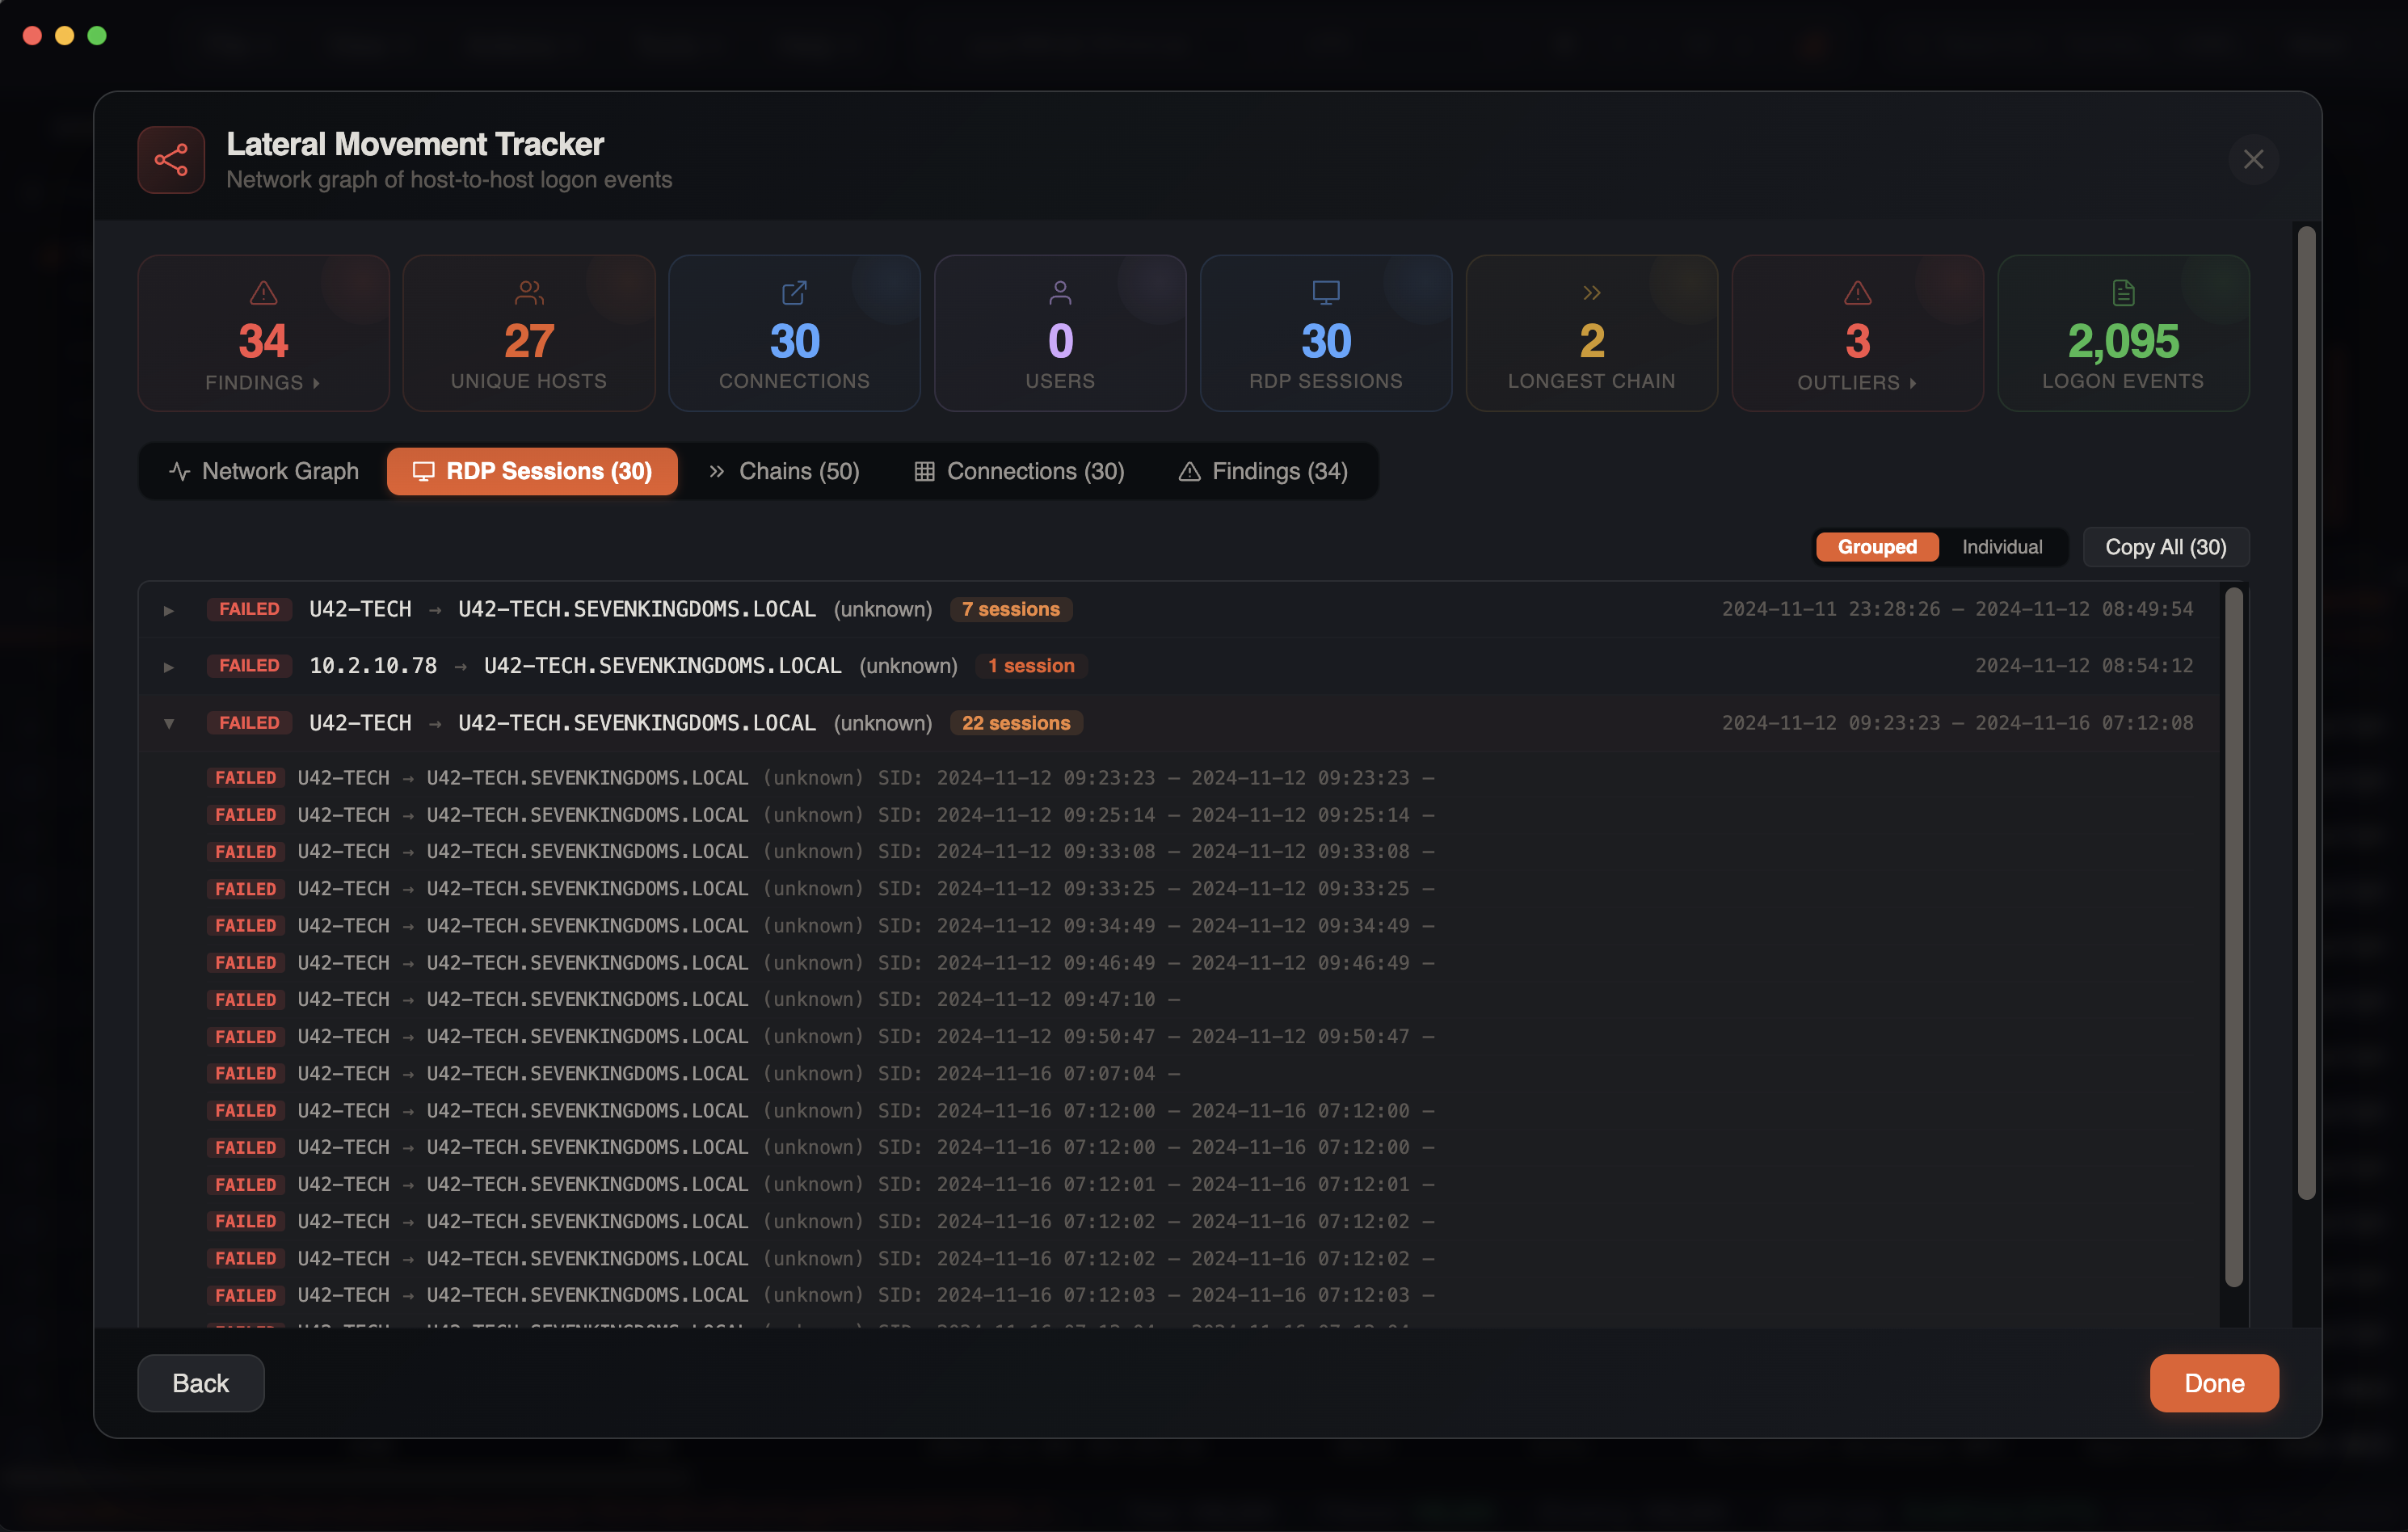
A complete RDP session correlation view that reconstructs the full lifecycle of each RDP session by linking related events across multiple log sources. Two view modes are available via a toggle in the tab header:
Grouped View (Default)
Sessions are grouped by source, target, user, and status into collapsible rows. Each group row shows:
- Status badge, source → target, user, session count (highlighted orange if > 5), and time range
- Click to expand and reveal individual sessions within the group with full details
Individual View
The detailed table view with one row per session:
Session columns:
| Column | Description |
|---|---|
| Status | Session state badge (see below) |
| Source | Origin host/IP |
| Target | Destination computer |
| User | Account used |
| Session ID | RDP session identifier |
| Events | Number of correlated events |
| Start Time | Session start timestamp |
| End Time | Session end timestamp |
| Duration | Human-readable duration (red if >24h, orange if >1h) |
| Flags | ADMIN badge (red) and/or RECONNECT badge (purple) |
Session states:
| Status | Color | Meaning |
|---|---|---|
| ACTIVE | Green | Session currently active |
| NO LOGOFF | Orange | Multiple events but no logoff recorded |
| DISCONNECTED | Yellow | Session disconnected but not ended |
| ENDED | Gray | Session cleanly terminated |
| FAILED | Red | Logon attempt failed |
| CONNECTING | Blue | Initial connection in progress |
| INCOMPLETE | Gray | Only one event, insufficient for correlation |
Session correlation algorithm:
The engine processes all RDP-related events chronologically, linking them into sessions using session keys (source→target|user|sessionId). Events are matched to sessions using time-window proximity:
| Event Type | Time Window |
|---|---|
| Admin privilege events (4672) | 5 seconds |
| Active session events (21, 22, 25, 4648, 4778) | 30 seconds |
| Disconnect/logoff events (24, 39, 40, 23, 4634, 4647, 4779) | 60 seconds |
Features:
- Expandable rows — click a session to reveal a timeline of all correlated events, shown as a vertical dot-line visualization with color-coded dots, event ID badges, descriptions, and timestamps
- Column sorting — click headers to sort ascending/descending
- Per-column checkbox filters — dropdown filters with search, select all/clear
- Column resizing — drag column borders to resize
- Checkbox selection — select sessions for copy operations
- Copy — exports selected or all sessions as tab-separated text
5. Connections
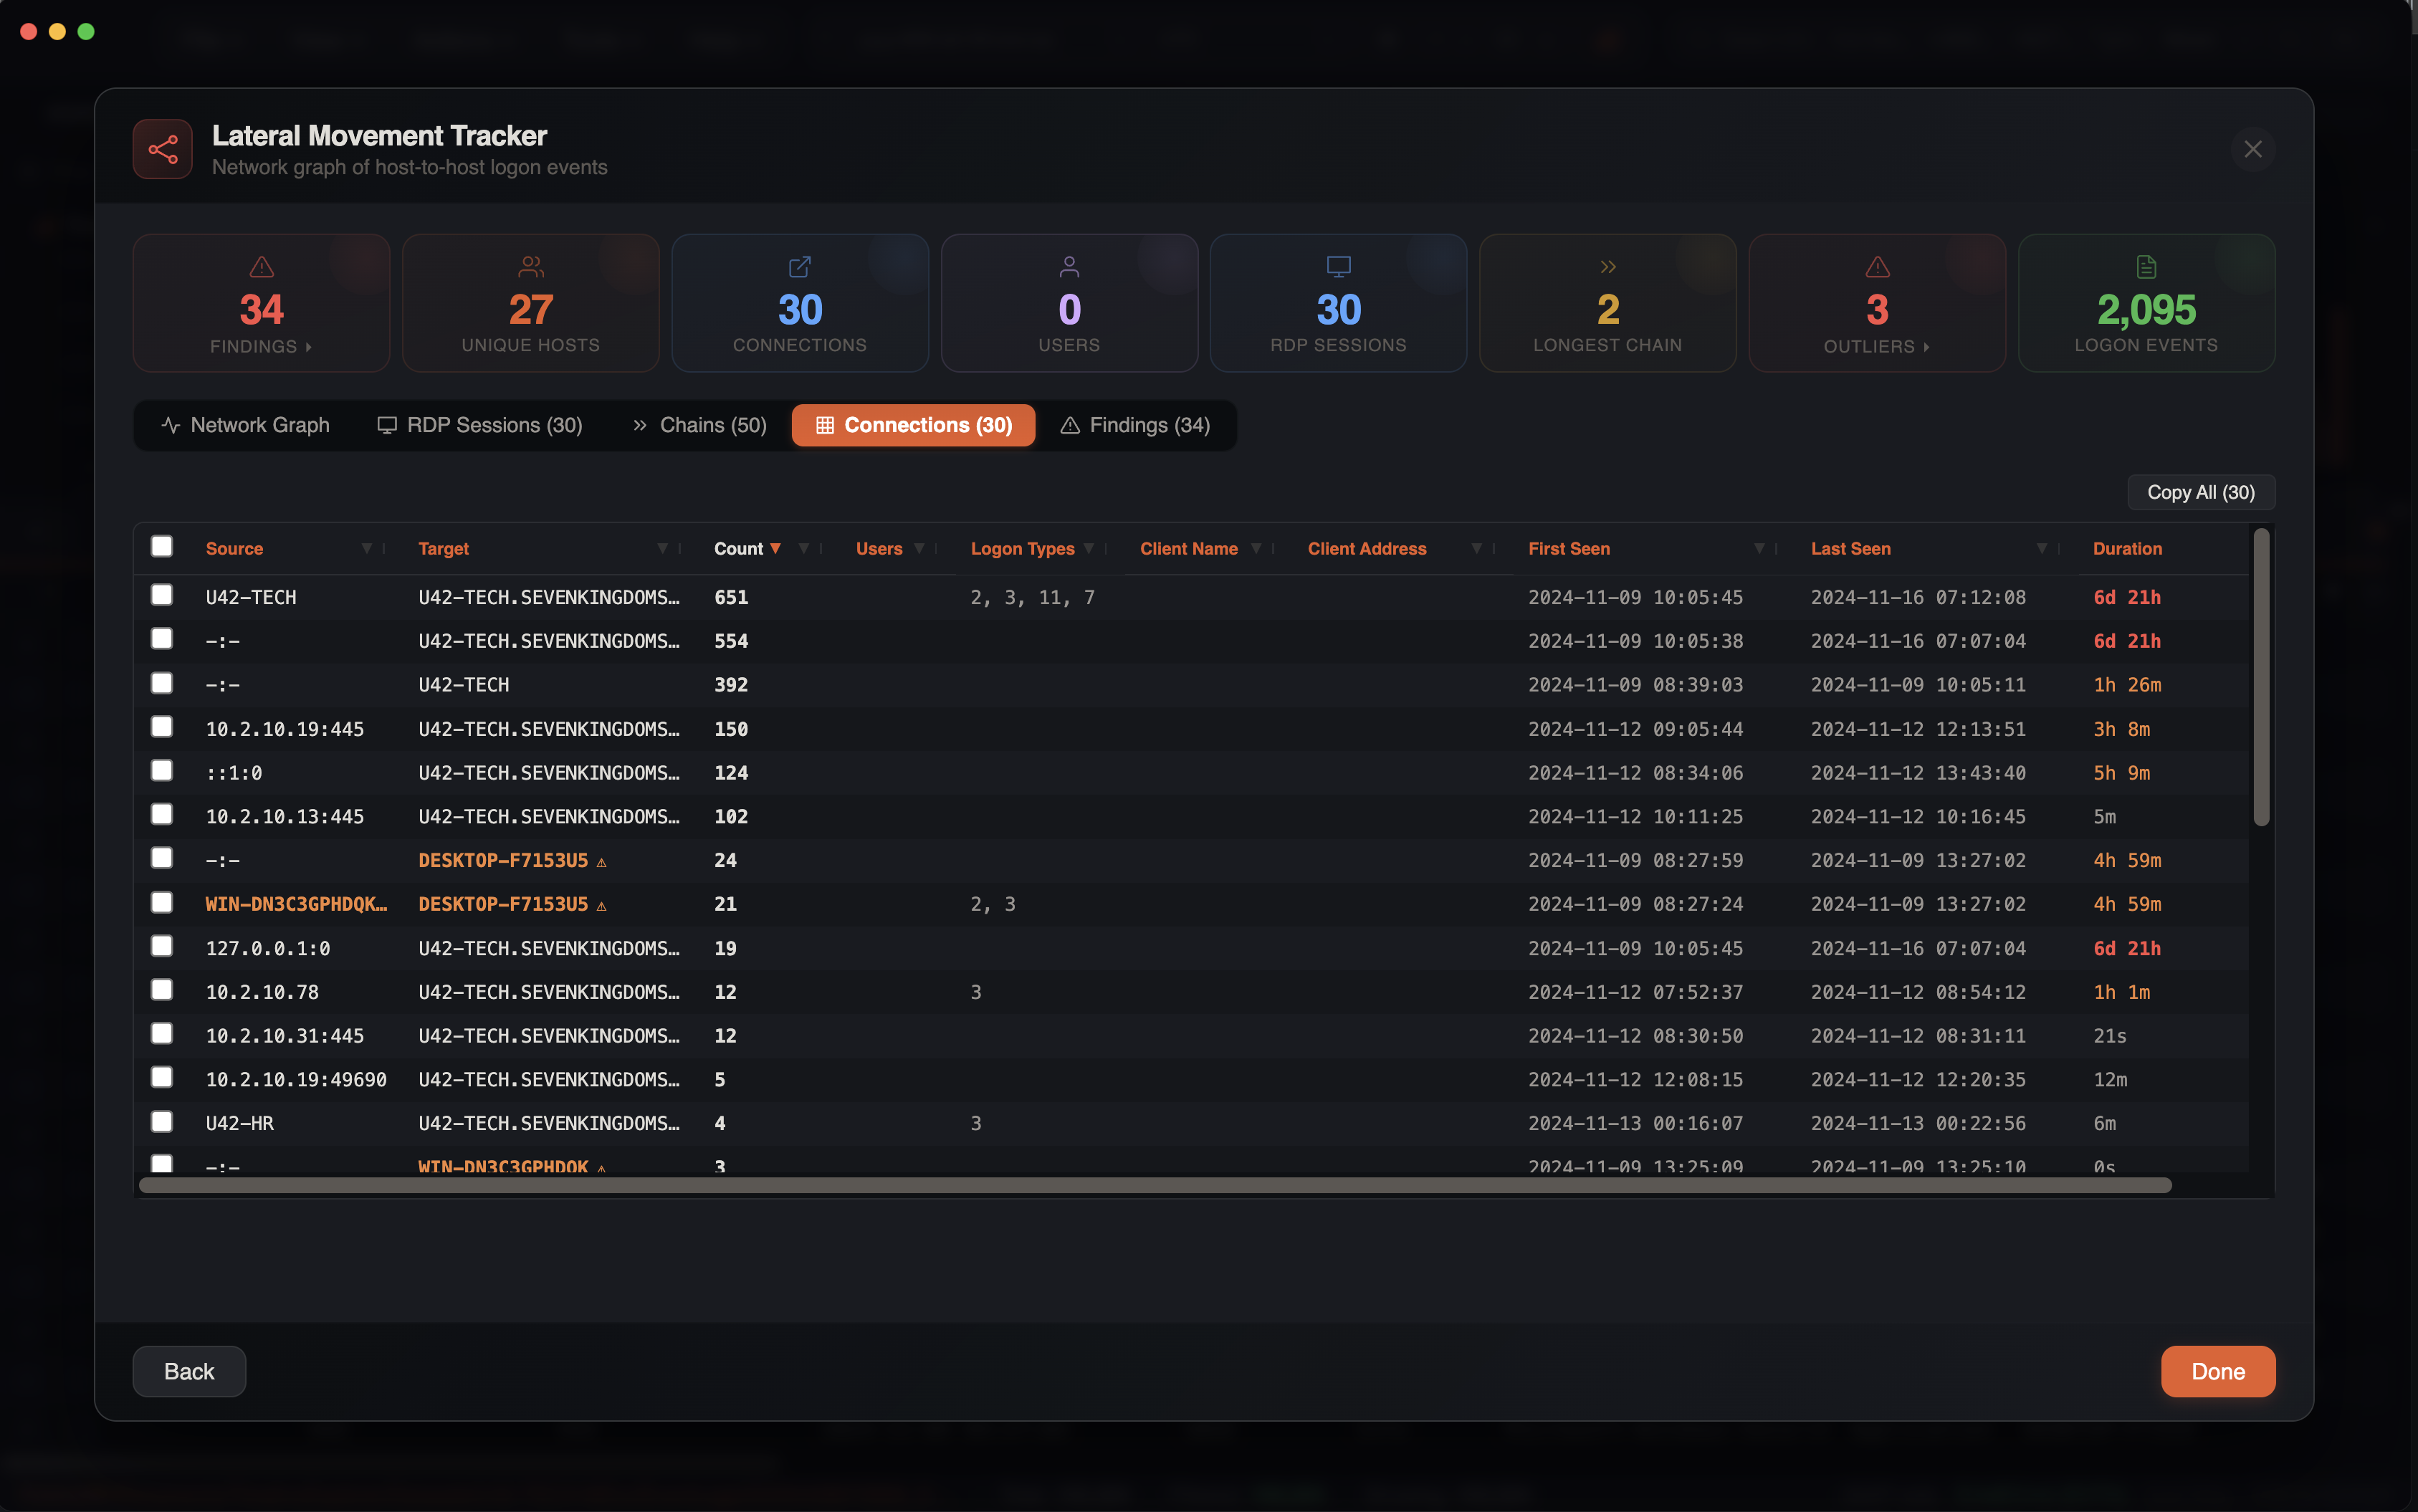
A tabular view of all connections with full details:
| Column | Description |
|---|---|
| Source | Origin host/IP |
| Target | Destination computer |
| User | Account used |
| Logon Type | Windows logon type |
| Count | Number of events |
Outlier and Suspicious Host Detection
The tracker uses a two-tier detection system to flag hosts that may indicate attacker-controlled machines.
Tier 1 — Outliers (Red)
Detected server-side during analysis. These are hostnames that strongly suggest non-corporate, default, or attacker-controlled machines:
| Pattern | Reason |
|---|---|
DESKTOP-XXXXX | Default Windows hostname (not renamed after install) |
WIN-XXXXX | Default Windows hostname |
KALI | Kali Linux default hostname |
PARROT | Parrot OS default hostname |
USER-PC, YOURNAME, ADMIN, TEST, HACKER, ATTACKER, ROOT, etc. | Generic or suspicious hostname |
WIN10, WIN11, OWNER-PC, LOCALHOST | Generic hostname |
| Non-ASCII characters | Unusual encoding in hostname |
Tier 2 — Suspicious Hosts (Orange)
Detected client-side as an additional layer. These catch patterns that may overlap with some legitimate names but warrant investigation:
| Pattern | Reason |
|---|---|
VPS | Virtual private server — common attacker infrastructure |
DESKTOP- + 7 alphanumeric chars | Precise default Windows 10/11 naming pattern |
WIN- + 8+ alphanumeric chars | Longer default Windows Server naming pattern |
WINVM | Virtual machine default name |
Visual Treatment
Each tier receives distinct visual treatment in the graph:
Outlier nodes (Tier 1):
- Red node color — rendered in red instead of the default node color
- Pulsing dashed ring — a dashed circle animates around the node with a 2-second pulse, drawing the eye to the host
- Hover tooltip — displays the specific detection reason
Suspicious hosts (Tier 2):
- Orange node color — rendered in amber/orange to distinguish from confirmed outliers
- Warning triangle badge — a small orange triangle with "!" appears on the node
- Hover tooltip — "Suspicious hostname pattern — possible threat actor workstation"
Both tiers share:
- Warning icons in Connections table — orange caution markers appear next to flagged hostnames
- Warning badges in edge detail panel — source/target badges are highlighted when a flagged host is involved
Find Flagged Button
When outliers or suspicious hosts are detected, a Find Flagged button appears in the graph toolbar showing the total count of flagged nodes. Clicking it cycles through each flagged host one by one, auto-zooming the graph to center on the node and selecting it for detail inspection.
Outlier Stats Card
The summary stats panel displays an outlier count card. When outliers are present, clicking the card zooms directly to the first outlier in the graph.
Noise Filtering
The tracker automatically excludes noise that would clutter the graph:
Excluded Sources
127.0.0.1and::1— local loopback0.0.0.0— unspecified address-and empty values — missing source addresses
Excluded Accounts
SYSTEMLOCAL SERVICENETWORK SERVICEANONYMOUS LOGONDWM-*(Desktop Window Manager)UMFD-*(User Mode Font Driver)- Machine accounts (
*$)
Session-Only Events
Events that provide session context but don't represent new connections (EIDs 23, 24, 39, 40, 4634, 4647, 4672, 4779) are collected for RDP session correlation but do not create graph edges.
Progress Bar
For large datasets, the lateral movement analysis shows a progress bar as it processes logon events. The analysis runs asynchronously so the UI remains responsive.
Investigation Tips
Focus on RDP
RDP connections (Type 10, blue edges) are often the most interesting for lateral movement investigations. Look for unexpected RDP connections between workstations or from unusual source IPs.
Cleartext Logons
Watch for red Type 8 edges — these indicate cleartext credentials sent over the network, which is both a security risk and a strong indicator of compromise.
RDP Sessions Tab
Use the RDP Sessions tab to see full session lifecycles. Long-duration sessions (>24h, shown in red) or sessions with the ADMIN flag warrant close investigation.
Multi-Hop Chains
Check the Chains tab for paths with 3+ hops. Legitimate administration rarely involves chain movements, while attackers often pivot through multiple systems.
Custom Detection Rules
Add custom rules to detect environment-specific lateral movement patterns. For example, add event IDs from your EDR or custom log sources with payload regex filters.
Combine with Timeline
After identifying suspicious connections in the graph, click through to the main grid to see the full context of those logon events in the timeline.