Sigma Detection
The Sigma Scan brings rule-based detection directly into IRFlow Timeline. It runs Sigma rules against Windows event data and surfaces MITRE ATT&CK-mapped findings in a triage dashboard built for incident response — no separate tooling, no Windows VM.
It is a dual-engine feature:
- Hayabusa engine — the bundled Hayabusa binary scans raw
.evtxfiles at full speed. It ships with IRFlow Timeline and self-updates its rule set. - In-app JS Sigma engine — a built-in compatibility engine that compiles Sigma detection YAML to a JavaScript predicate and runs it against data you have already imported (current tab) or against EvtxECmd CSV/XLS/XLSX output. Use it when raw
.evtxfiles are not available.
Opening the Sigma Scan
- Menu: Tools → Detection → Sigma Scan
- Capability launcher: Sigma · Hayabusa on the home screen
When you open it, IRFlow Timeline picks a smart default: if a timeline tab is already loaded it pre-selects that tab as the scan target (one-click scan); otherwise it opens on EVTX Folder for a raw .evtx directory scan.
The modal has three top-level views, selectable from the toggle at the top:
- New Scan — the configuration wizard (default)
- Previous Scans — persisted scan history you can reopen
- Detection Settings — engine maintenance, rule sources, and advanced defaults
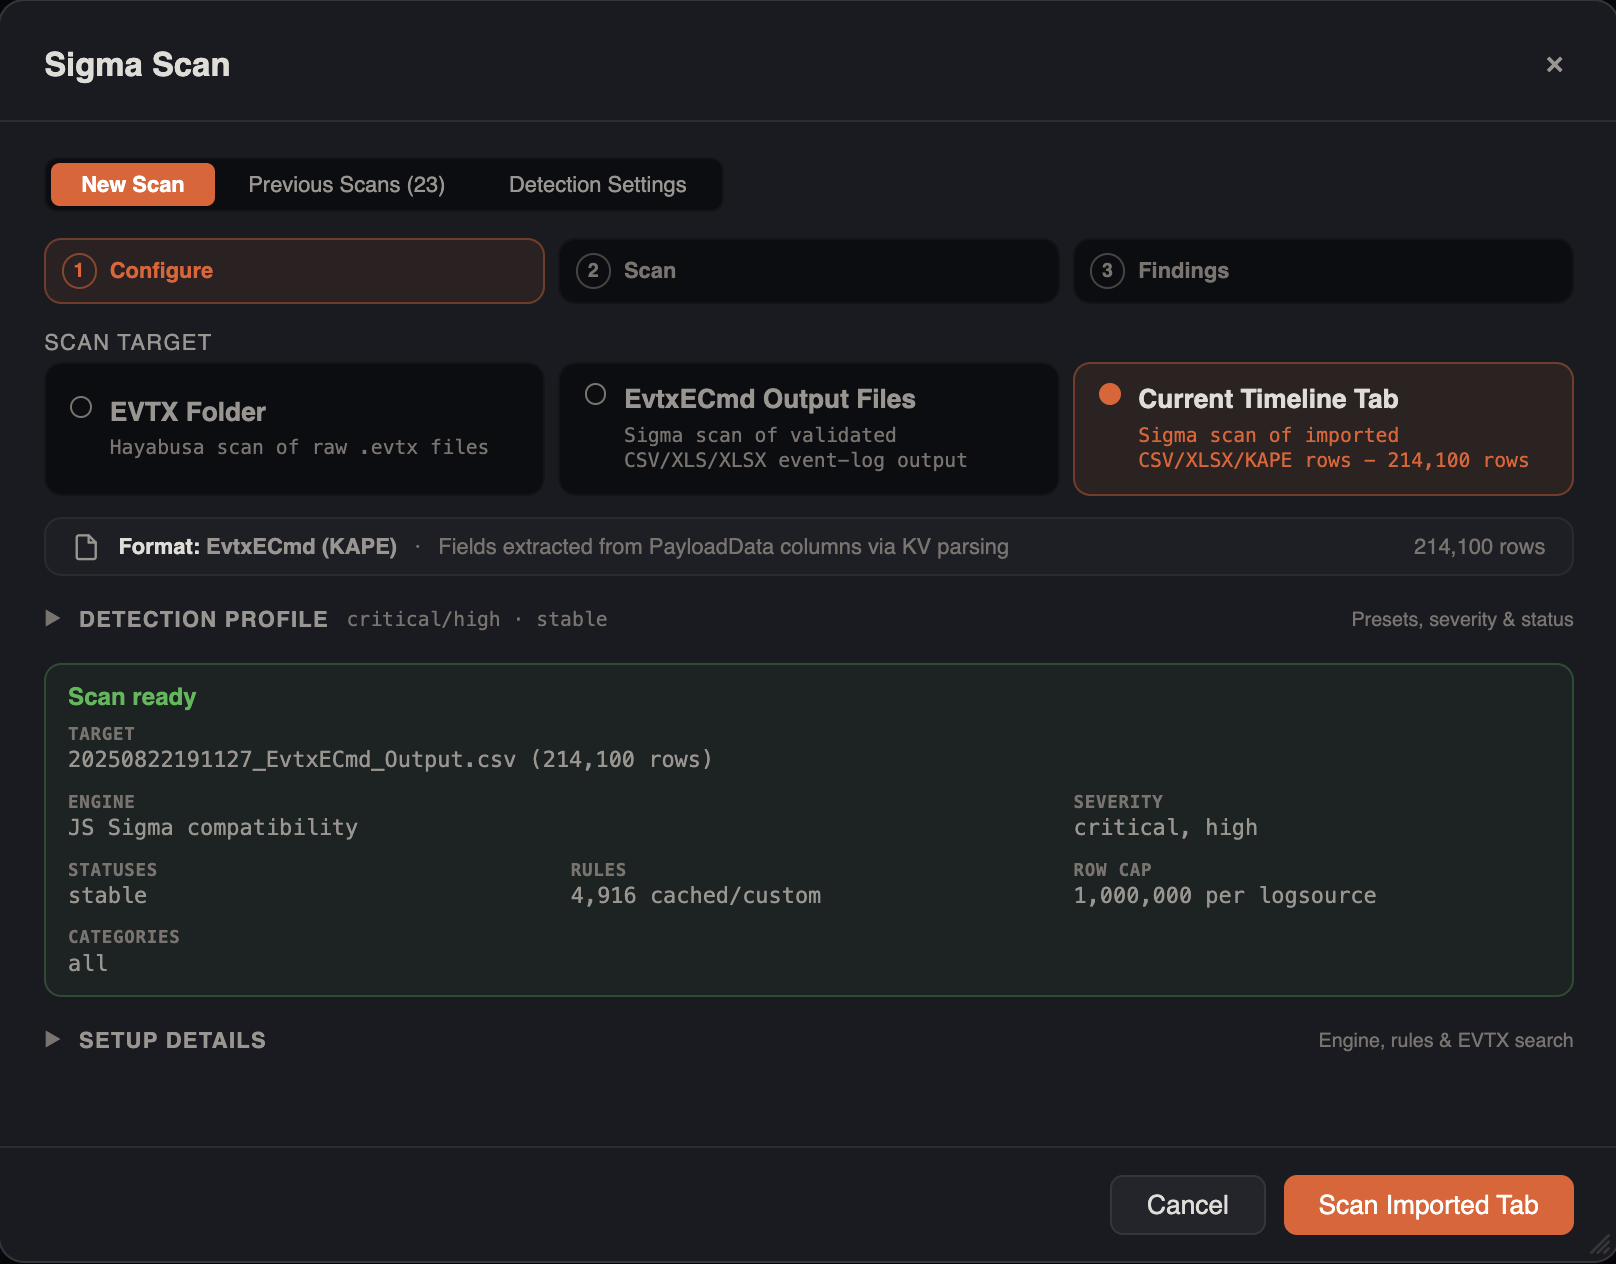
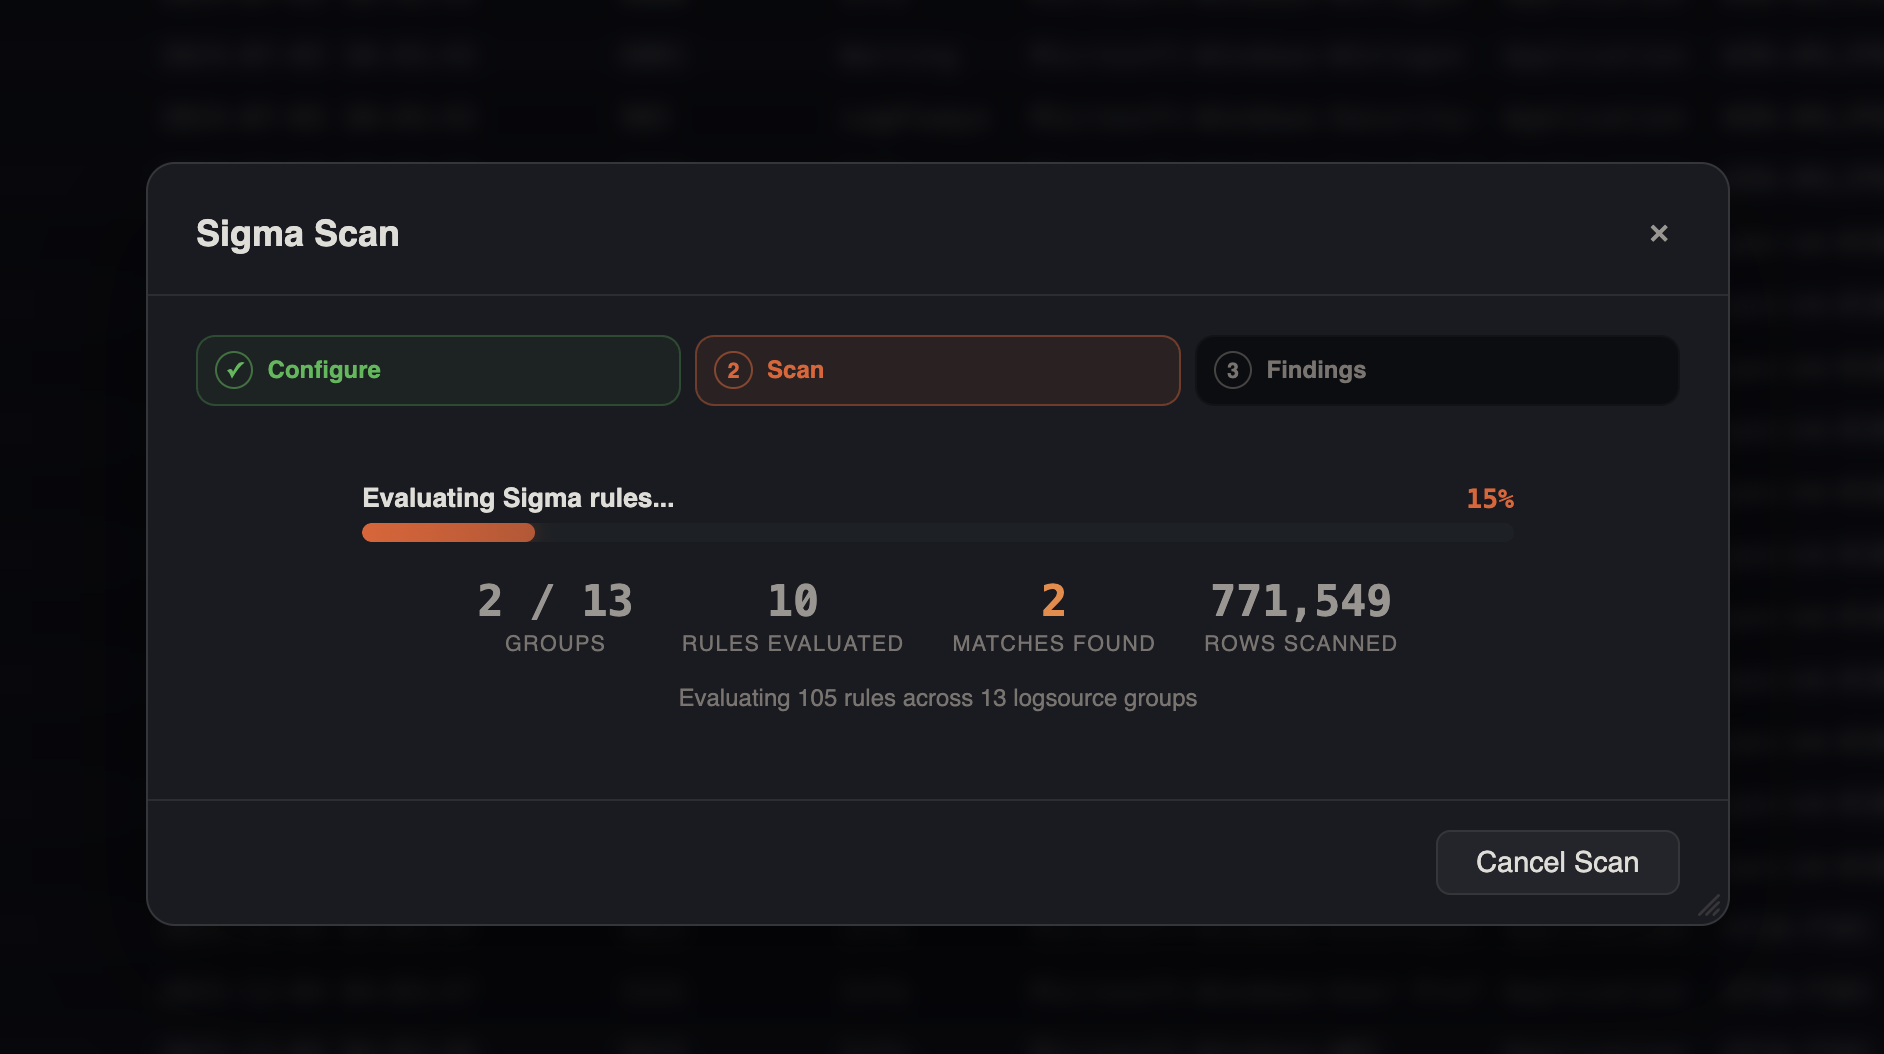
The wizard walks through three steps — Configure (target + detection profile), Scan (progress), and Findings (results) — with a Scan Ready panel summarizing the chosen target, engine, severity, statuses, rule count, and row cap before you run.
Scan progress
While a scan runs, the wizard stays on the Scan step with live progress from the Hayabusa subprocess or the in-app JS Sigma engine. You can cancel in flight; large EVTX folders may take several minutes.
Scan Targets
The first step of the wizard is choosing what to scan. The target determines which engine runs.
| Target | Engine | Input | Use it for |
|---|---|---|---|
| EVTX Folder | Hayabusa | A directory of raw .evtx files | Fastest, highest-fidelity scan when you have raw event logs |
| EvtxECmd Output Files | JS Sigma | Validated EvtxECmd CSV/XLS/XLSX output | KAPE collections already parsed by EvtxECmd |
| Current Timeline Tab | JS Sigma | Rows already imported into the active tab | Scanning data you are already triaging |
For EvtxECmd Output Files you can select individual files or use Find in Folder to discover valid outputs inside a KAPE collection. Unrelated or invalid KAPE files are ignored automatically, and only validated event-log outputs are scanned.
For Current Timeline Tab, the wizard auto-detects the data format and adapts field mapping accordingly:
| Detected format | Field extraction |
|---|---|
| EvtxECmd (KAPE) | Fields extracted from PayloadData columns via key/value parsing |
| Hayabusa | Fields extracted from Details / ExtraFieldInfo compact format |
| Raw EVTX | Fields matched directly from EventData columns |
| CSV / Standard | Best-effort column matching |
Detection Profile
The Detection profile section (collapsed by default) controls which rules fire and at what confidence.
Scan Presets
Built-in presets give you a one-click starting point:
| Preset | Description |
|---|---|
| Fast high-confidence only | Critical/high, stable+test rules, EID-filtered — lowest false-positive path |
| Full hunt | All severities and statuses, all rules, scans every EVTX file — broadest coverage |
| Critical/high only | Critical/high across all rule statuses |
You can also save your own presets from the current configuration and reuse them across cases.
Severity
- Hayabusa (EVTX Folder) — a single Minimum Severity selector: Critical only, High and above, Medium and above, Low and above, or Informational and above.
- JS Sigma (tab / EvtxECmd) — independent Severity Filter checkboxes for Critical, High, Medium, Low, and Informational.
Status
Filter rules by maturity: stable, test, and experimental.
Rule Categories
For JS Sigma compatibility scans, a category breakdown lets you include or exclude specific Sigma rule categories (each shown with its rule count) to focus the scan.
Detection Settings
The Detection Settings view holds engine maintenance and advanced defaults. Changes auto-save as global defaults.
Hayabusa Engine
- View the installed engine version and rule count.
- Install Hayabusa if it is not yet present (it is otherwise downloaded automatically on first scan).
- Update Rules — refresh the Hayabusa rule set.
- Update Hayabusa — upgrade the binary itself.
- Open Rules Config Folder — inspect the on-disk rule configuration.
Disabled / Noisy Rules
A suppression manager for muting known-noisy rules:
- Add suppressions by Rule ID with an optional title and reason.
- Scope each suppression Global (all cases) or Case-specific (a named case/dataset).
- IRFlow ships default noisy-rule tuning entries — these can be toggled off but not removed.
- Enabled global suppressions are written to Hayabusa's
noisy_rules.txt; JS Sigma scans skip suppressed rule IDs.
Compatibility Rule Sources
Used only for JS Sigma (Current Tab / EvtxECmd) scans:
- Download rules from selectable repositories (recommended defaults are flagged).
- Import your own YAML rules into the custom rules folder (
~/sigma-customby default). - A JS compatibility report summarizes how many rules are compatible, parsed, unsupported, or skipped, and breaks down unsupported rules by modifier, condition, and logsource.
Hayabusa Scan Defaults
These tune raw EVTX scans:
Rule Set
| Set | Description |
|---|---|
| All Rules | Every detection rule |
| Core | Stable+test, high+critical — lowest false positives |
| Core+ | Stable+test, medium and above — needs tuning |
| Core++ | All statuses, medium and above — broader hunt |
| Emerging Threats | Current threat campaigns |
| Threat Hunting | Unknown malware — highest false-positive rate |
Output Profile — minimal, standard, verbose (default), all-field-info, all-field-info-verbose, super-verbose, and Timesketch profiles. Output mode — CSV, JSON, or JSONL.
Scan Options — recover deleted records, UTC timestamps, proven rules only, include noisy/deprecated/unsupported rules, EID filter (faster scan), enable ALL rules (-A), scan ALL EVTX files (-a), and GeoIP enrichment (MaxMind GeoLite2, with auto-download).
Advanced Filters — include/exclude by MITRE tags, computers, or Event IDs, plus an optional scan Time Range and custom Hayabusa rules directory / rules config YAML.
Triage Tools (Raw EVTX)
When scanning an EVTX folder with Hayabusa installed, a collapsible Triage Tools section runs Hayabusa metrics over the directory before or independently of a full detection scan:
- Log Metrics — event volume breakdown
- Computers — hosts present in the data
- Event IDs — event ID frequency
- Logons — successful and failed logon tables
- Pivot IOCs — keyword pivots grouped by category (requires high+ detections)
- Base64 Decode — decoded encoded command lines
EVTX Search Utility
A keyword/regex hunt over raw EVTX events, available in the wizard's Setup details for EVTX folder scans. Search comma-separated keywords (with optional AND logic) or a regex pattern, optionally constrained to a field filter and time range — useful for a quick sweep before or after the detection scan.
Results and Triage
After a scan completes, results open into the Look Here First triage dashboard.
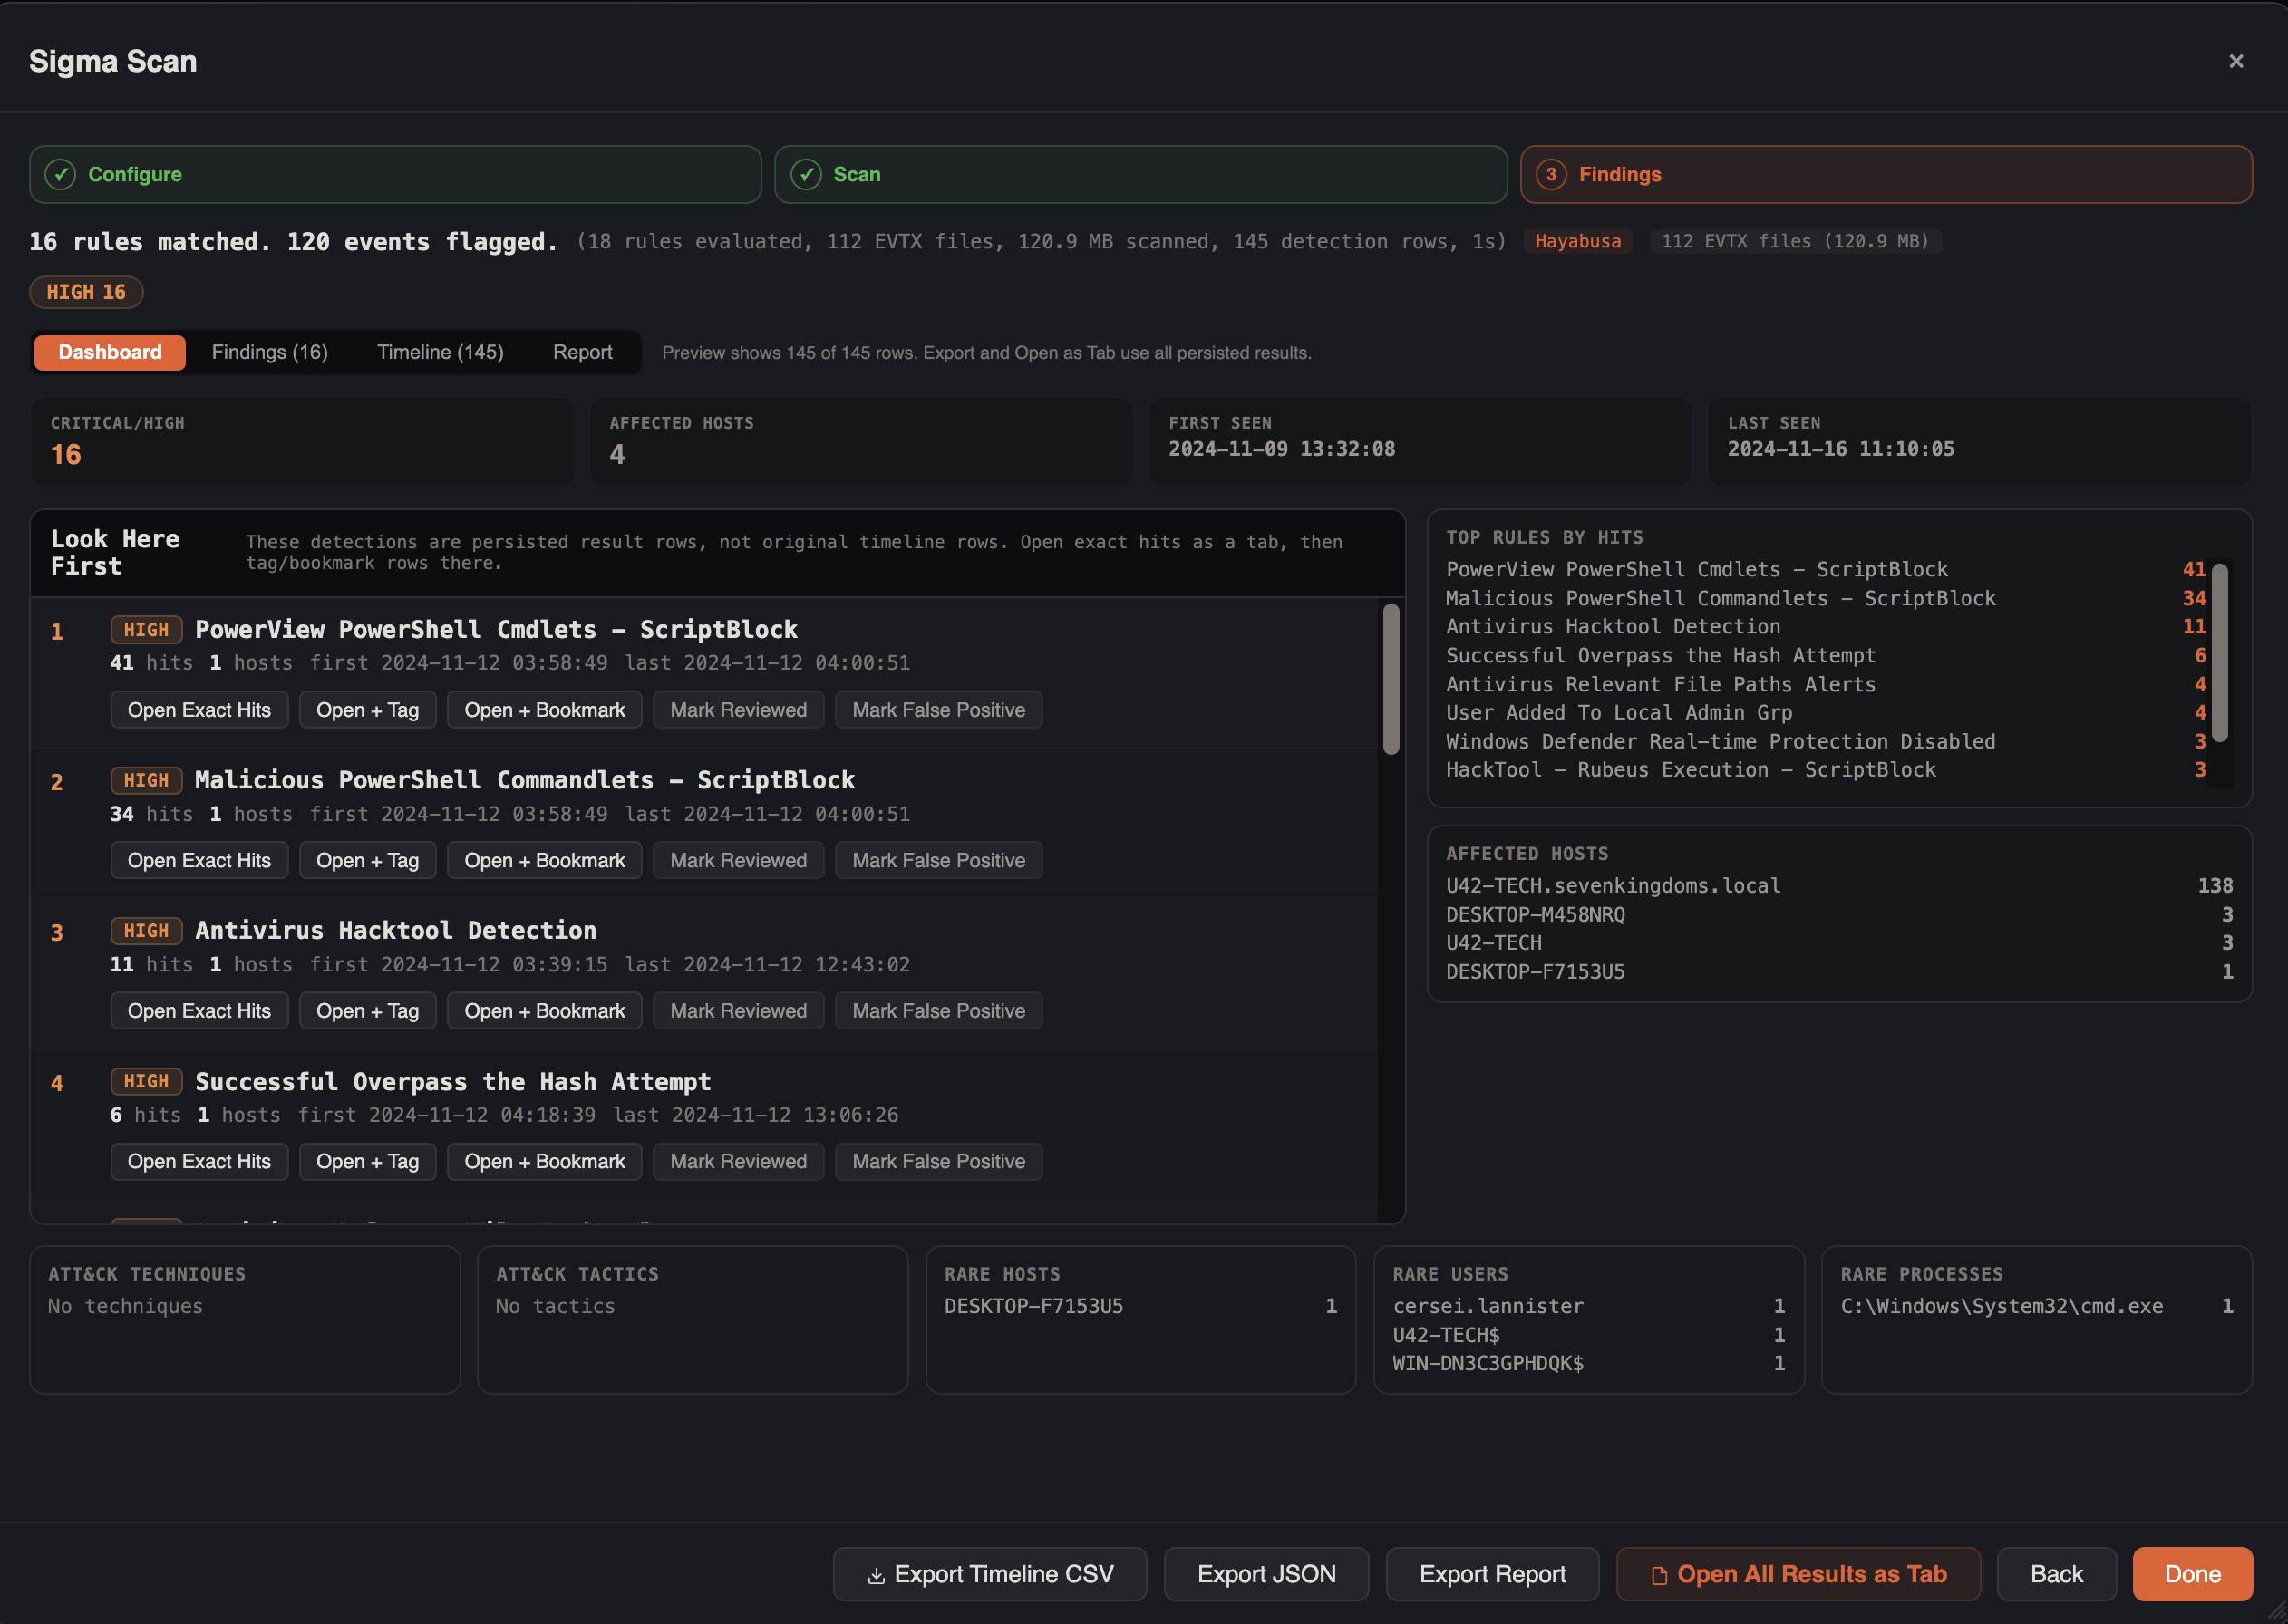
The results screen has Dashboard, Findings, Timeline, and Report tabs, with export options (Export Timeline CSV, Export JSON, Export Report) and Open All Results as Tab.
Summary Cards
Four cards at the top: Critical/High count, Affected Hosts, First Seen, and Last Seen.
Priority Findings
A ranked list of the highest-priority detections, each showing:
- Severity badge and rule title
- Hit count and number of affected hosts
- First/last seen timestamps
- MITRE ATT&CK technique badges
- Review state pills (reviewed, false positive, tagged, bookmarked)
Each finding has inline actions:
- Open Exact Hits — open the matching rows as a focused result tab
- Tag / Bookmark — annotate the matching rows (for persisted result scans, this opens the exact hits as a tab and annotates every row automatically)
- Mark Reviewed / Mark False Positive — track triage state per rule
Supporting Panels
- Top Rules by Hits and Affected Hosts side panels
- Bottom row: ATT&CK Techniques, ATT&CK Tactics, Rare Hosts, Rare Users, and Rare Processes — frequency-based outlier surfacing to spotlight anomalies
Scan History
Every scan is persisted. The Previous Scans view lists prior runs so you can reopen results without rescanning — useful for revisiting a case or comparing runs.
Performance Notes
Prefer raw EVTX + Hayabusa
When raw .evtx files are available, the EVTX Folder + Hayabusa path is the full-speed option. The JS Sigma engine is a compatibility path for data that has already been parsed or imported.
Large compatibility scans
JS Sigma compatibility scans cap each logsource group at 1,000,000 candidate rows to avoid runaway memory and CPU use. IRFlow Timeline warns when scanning a large tab (500,000+ rows) or 1 GB+ of EvtxECmd output and recommends the Hayabusa path instead.
Scans are cancellable — stopping a scan terminates the underlying Hayabusa subprocess or JS evaluation loop.
Investigation Tips
Start with a high-confidence preset
Begin with Fast high-confidence only to surface the strongest signals, then widen severity/status or switch to Full hunt once you understand the dataset.
Triage the rare columns
The Rare Hosts / Users / Processes panels are often where novel attacker activity hides — a single unusual host or process is worth a closer look even without a high-severity hit.
Tune noise per case
Use Disabled / Noisy Rules with case-specific scope to silence environment-specific false positives without losing the rule globally.
Pivot into the timeline
Use Open Exact Hits to pull a detection's matching events into a tab, then correlate with the Process Inspector and Lateral Movement Tracker to reconstruct the surrounding activity.
See Also
- Process Inspector — reconstruct process trees around a detection
- Lateral Movement Tracker — correlate detections with host-to-host movement
- Persistence Analyzer — rule-based persistence detection alongside Sigma
- IOC Matching — sweep matched indicators against threat intel
- KAPE Integration — scan EvtxECmd output straight from a KAPE collection