
Quick Start
Get up and running with your first timeline analysis in under a minute.
Open a File
There are three ways to open a file:
- Menu: File → Open (
Cmd+O) - Drag and drop: Drag a file onto the application window
- Double-click: Double-click a supported file in Finder
IRFlow Timeline will automatically detect the file format and begin streaming the import.
Capability Launcher
When no timeline tab is active, the home view shows capability cards — shortcuts into the main investigation workflows without hunting through menus first.
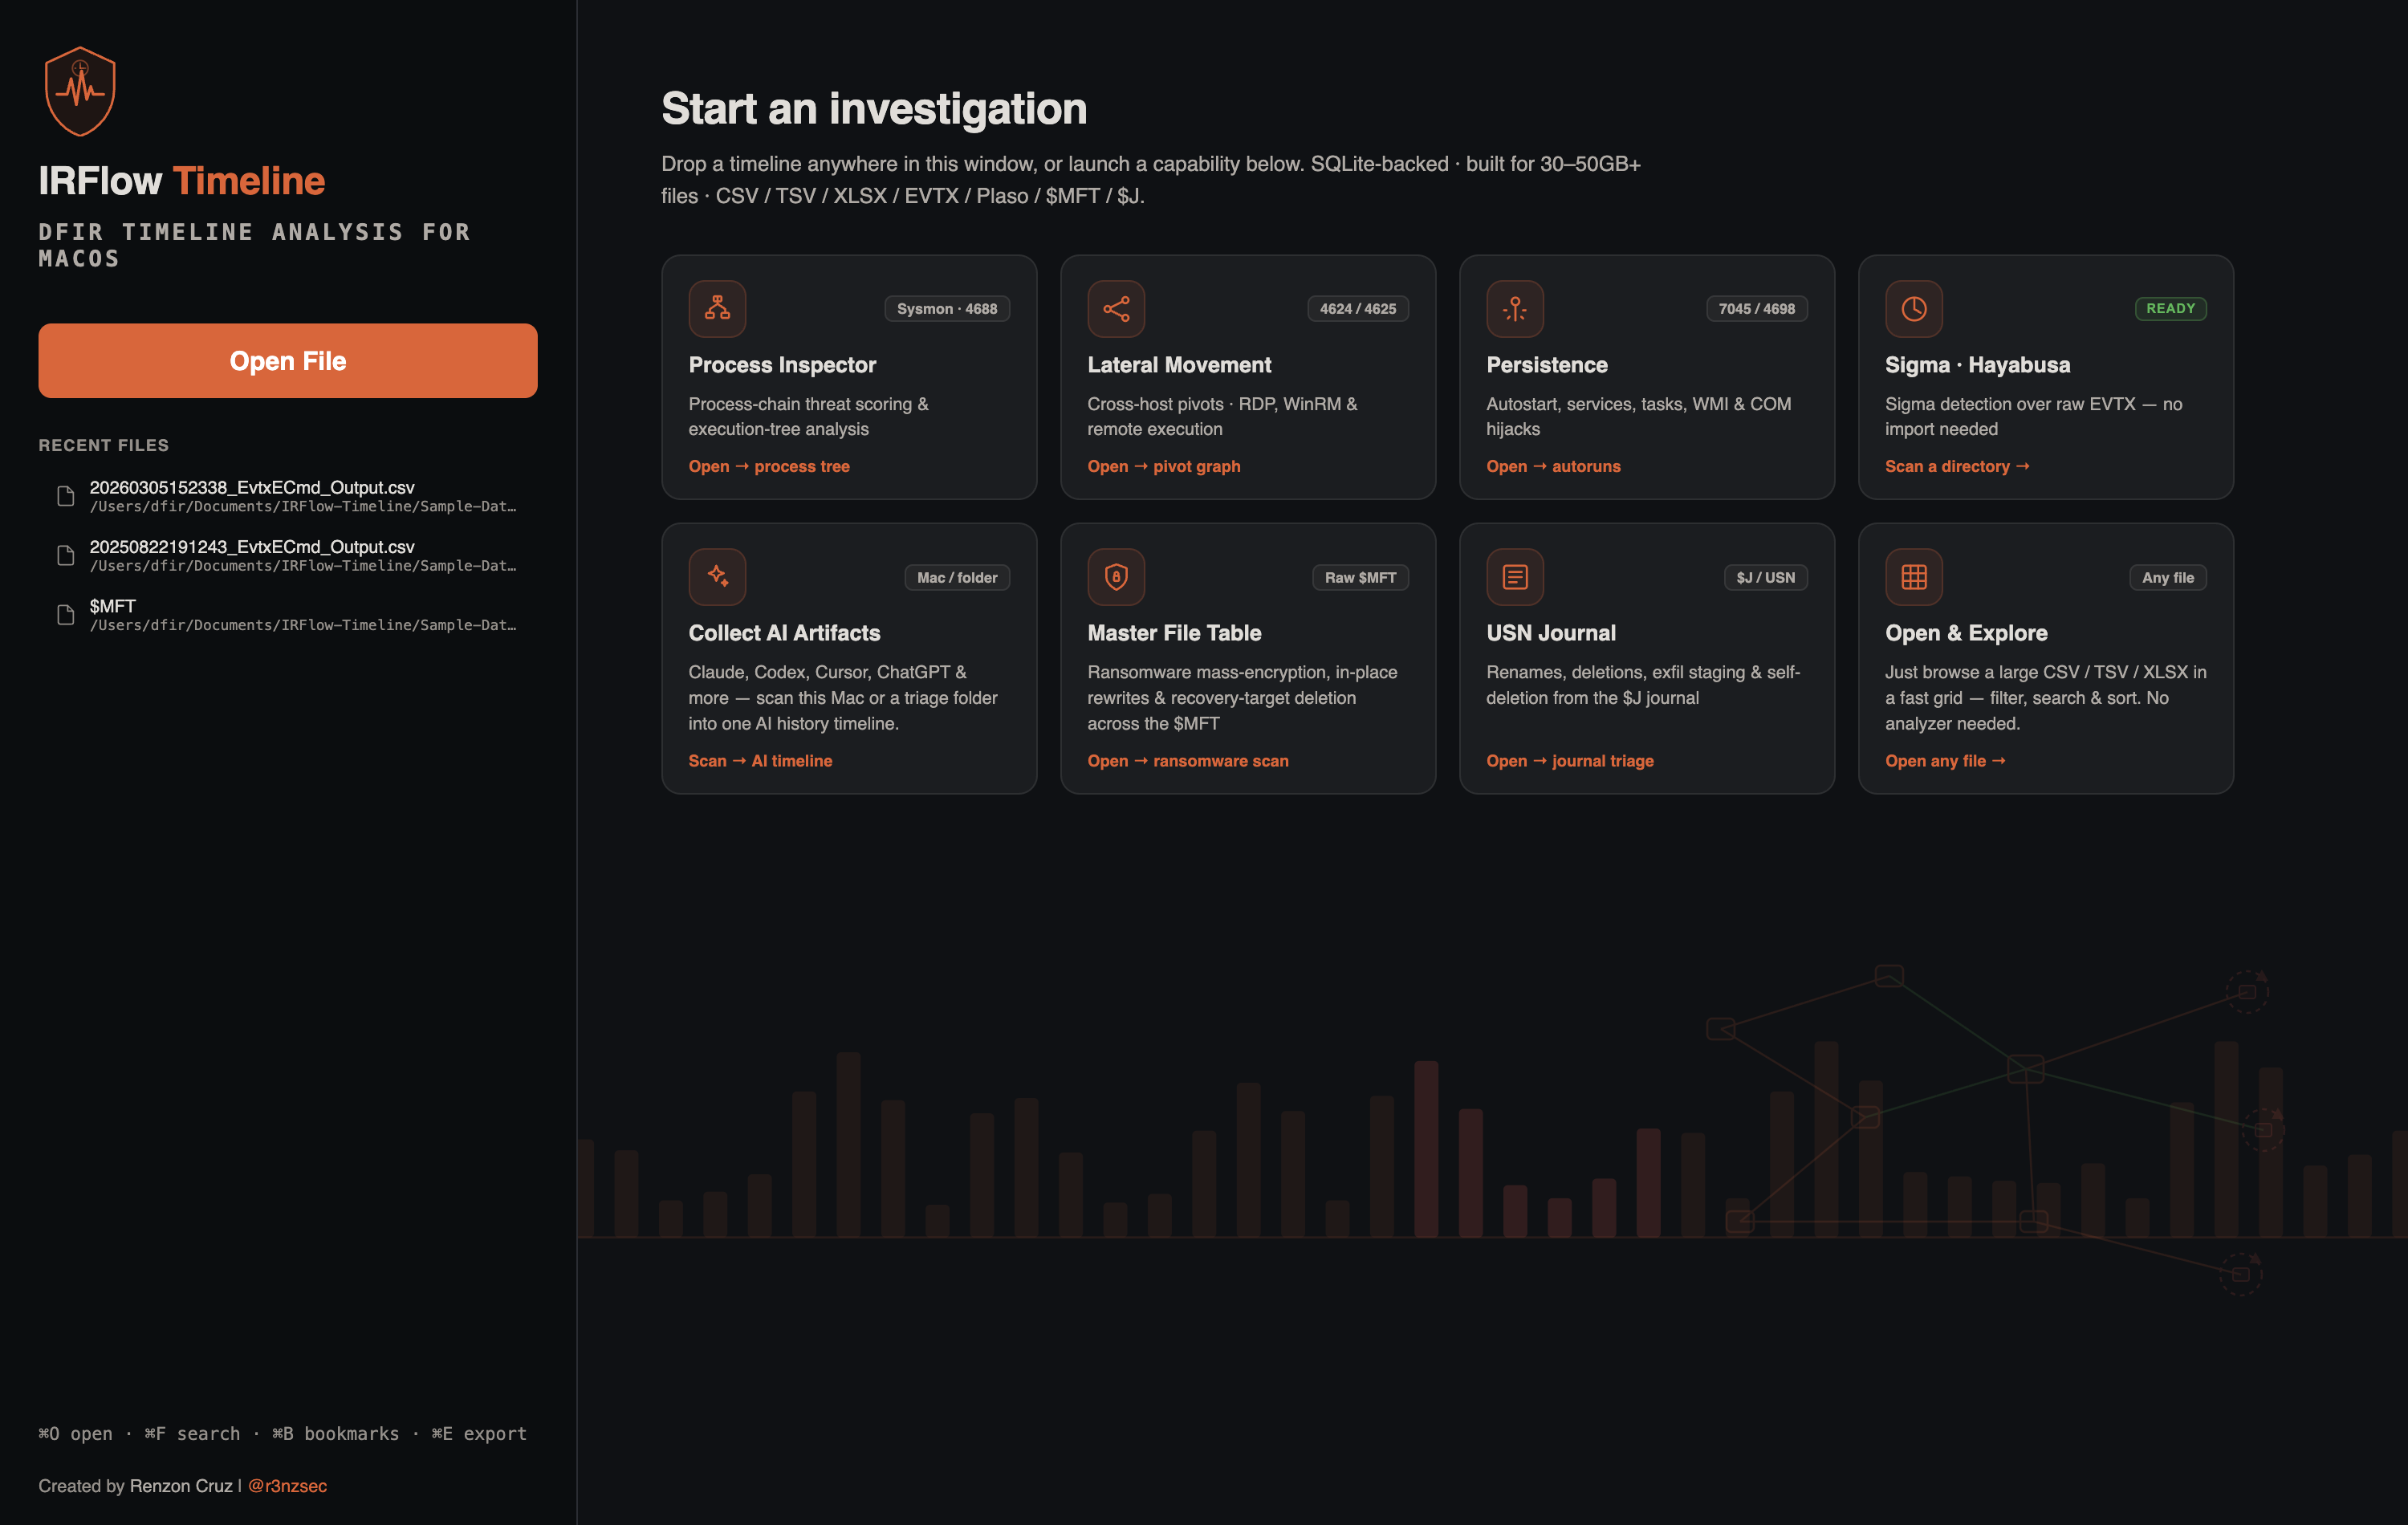
Each card opens the relevant analyzer or file dialog. Cards that need an imported tab (for example Process Inspector or Persistence) guide you to load data first; Collect AI Artifacts, Sigma · Hayabusa, and Open & Explore work immediately.
Import Progress
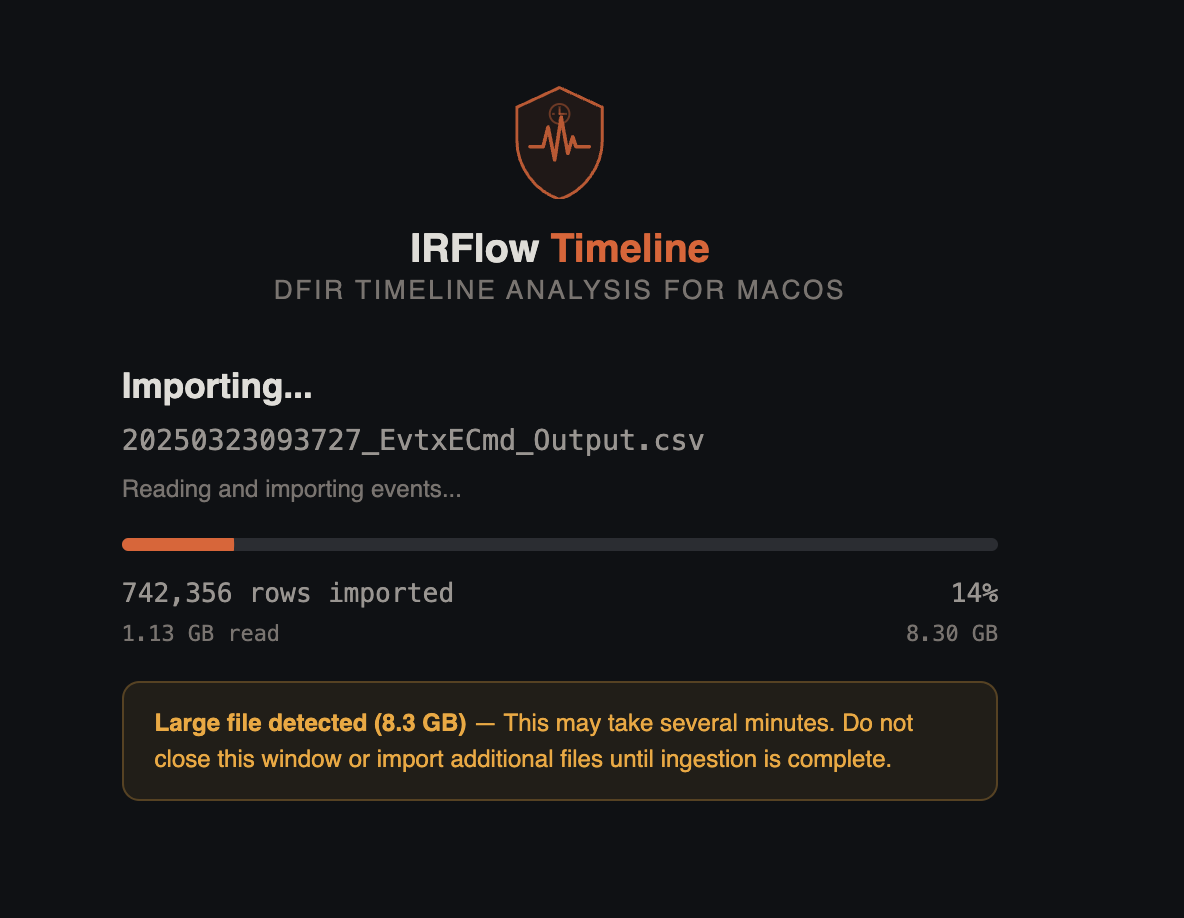
During import you will see:
- A progress bar showing rows imported
- Automatic delimiter detection for CSV/TSV files
- Sheet selection dialog for multi-sheet Excel files
- Column discovery for EVTX files
Large Files
Files over 1GB may take a minute to import. The streaming architecture processes data in 128MB chunks with adaptive batch sizes (up to 100,000 rows per batch), so the UI remains responsive throughout. After import, column indexes and full-text search indexes build in the background — you can start working immediately.
Navigate the Grid
Once imported, your data appears in a virtual-scrolling grid:
- Scroll through millions of rows smoothly — only ~10,000 rows are loaded at a time
- Sort by clicking any column header (click again to toggle ASC/DESC)
- Resize columns by dragging the column header borders
- Pin columns by
Cmd+Clickon a header and selecting Pin Left - Select rows by clicking; hold
Shiftfor range selection
Search Your Data
Use the search bar at the top (Cmd+F):
- Type your search term
- Select a search mode from the dropdown:
- Mixed — Combines full-text and substring search (default)
- FTS — Full-text search (word-level matching)
- LIKE — Substring match
- Fuzzy — Tolerates typos
- Regex — Regular expression patterns
Results update as you type (debounced at 500ms).
Filter by Column
Click the filter icon on any column header to:
- Text filter: Type to match values in that column
- Checkbox filter: Select/deselect specific unique values
- Date range: For timestamp columns, pick a start and end date
Bookmark Important Rows
Click the star icon on any row to bookmark it. Bookmarked rows are preserved across sessions and included in exported reports.
Toggle Cmd+B to show only bookmarked rows.
Add Tags
Cmd+Click a row and select Add Tag to annotate it. Tags are color-coded and can be used for filtering and reporting. Common tags include:
- Suspicious
- Lateral Movement
- Exfiltration
- Persistence
- C2
View the Histogram
Click the histogram toggle button in the toolbar to open the timeline visualization:
- See event distribution across days, hours, or minutes
- Click and drag to brush-select a time range — the grid filters automatically
- Color-coded by artifact source when using merged timelines
Run a Detection Scan
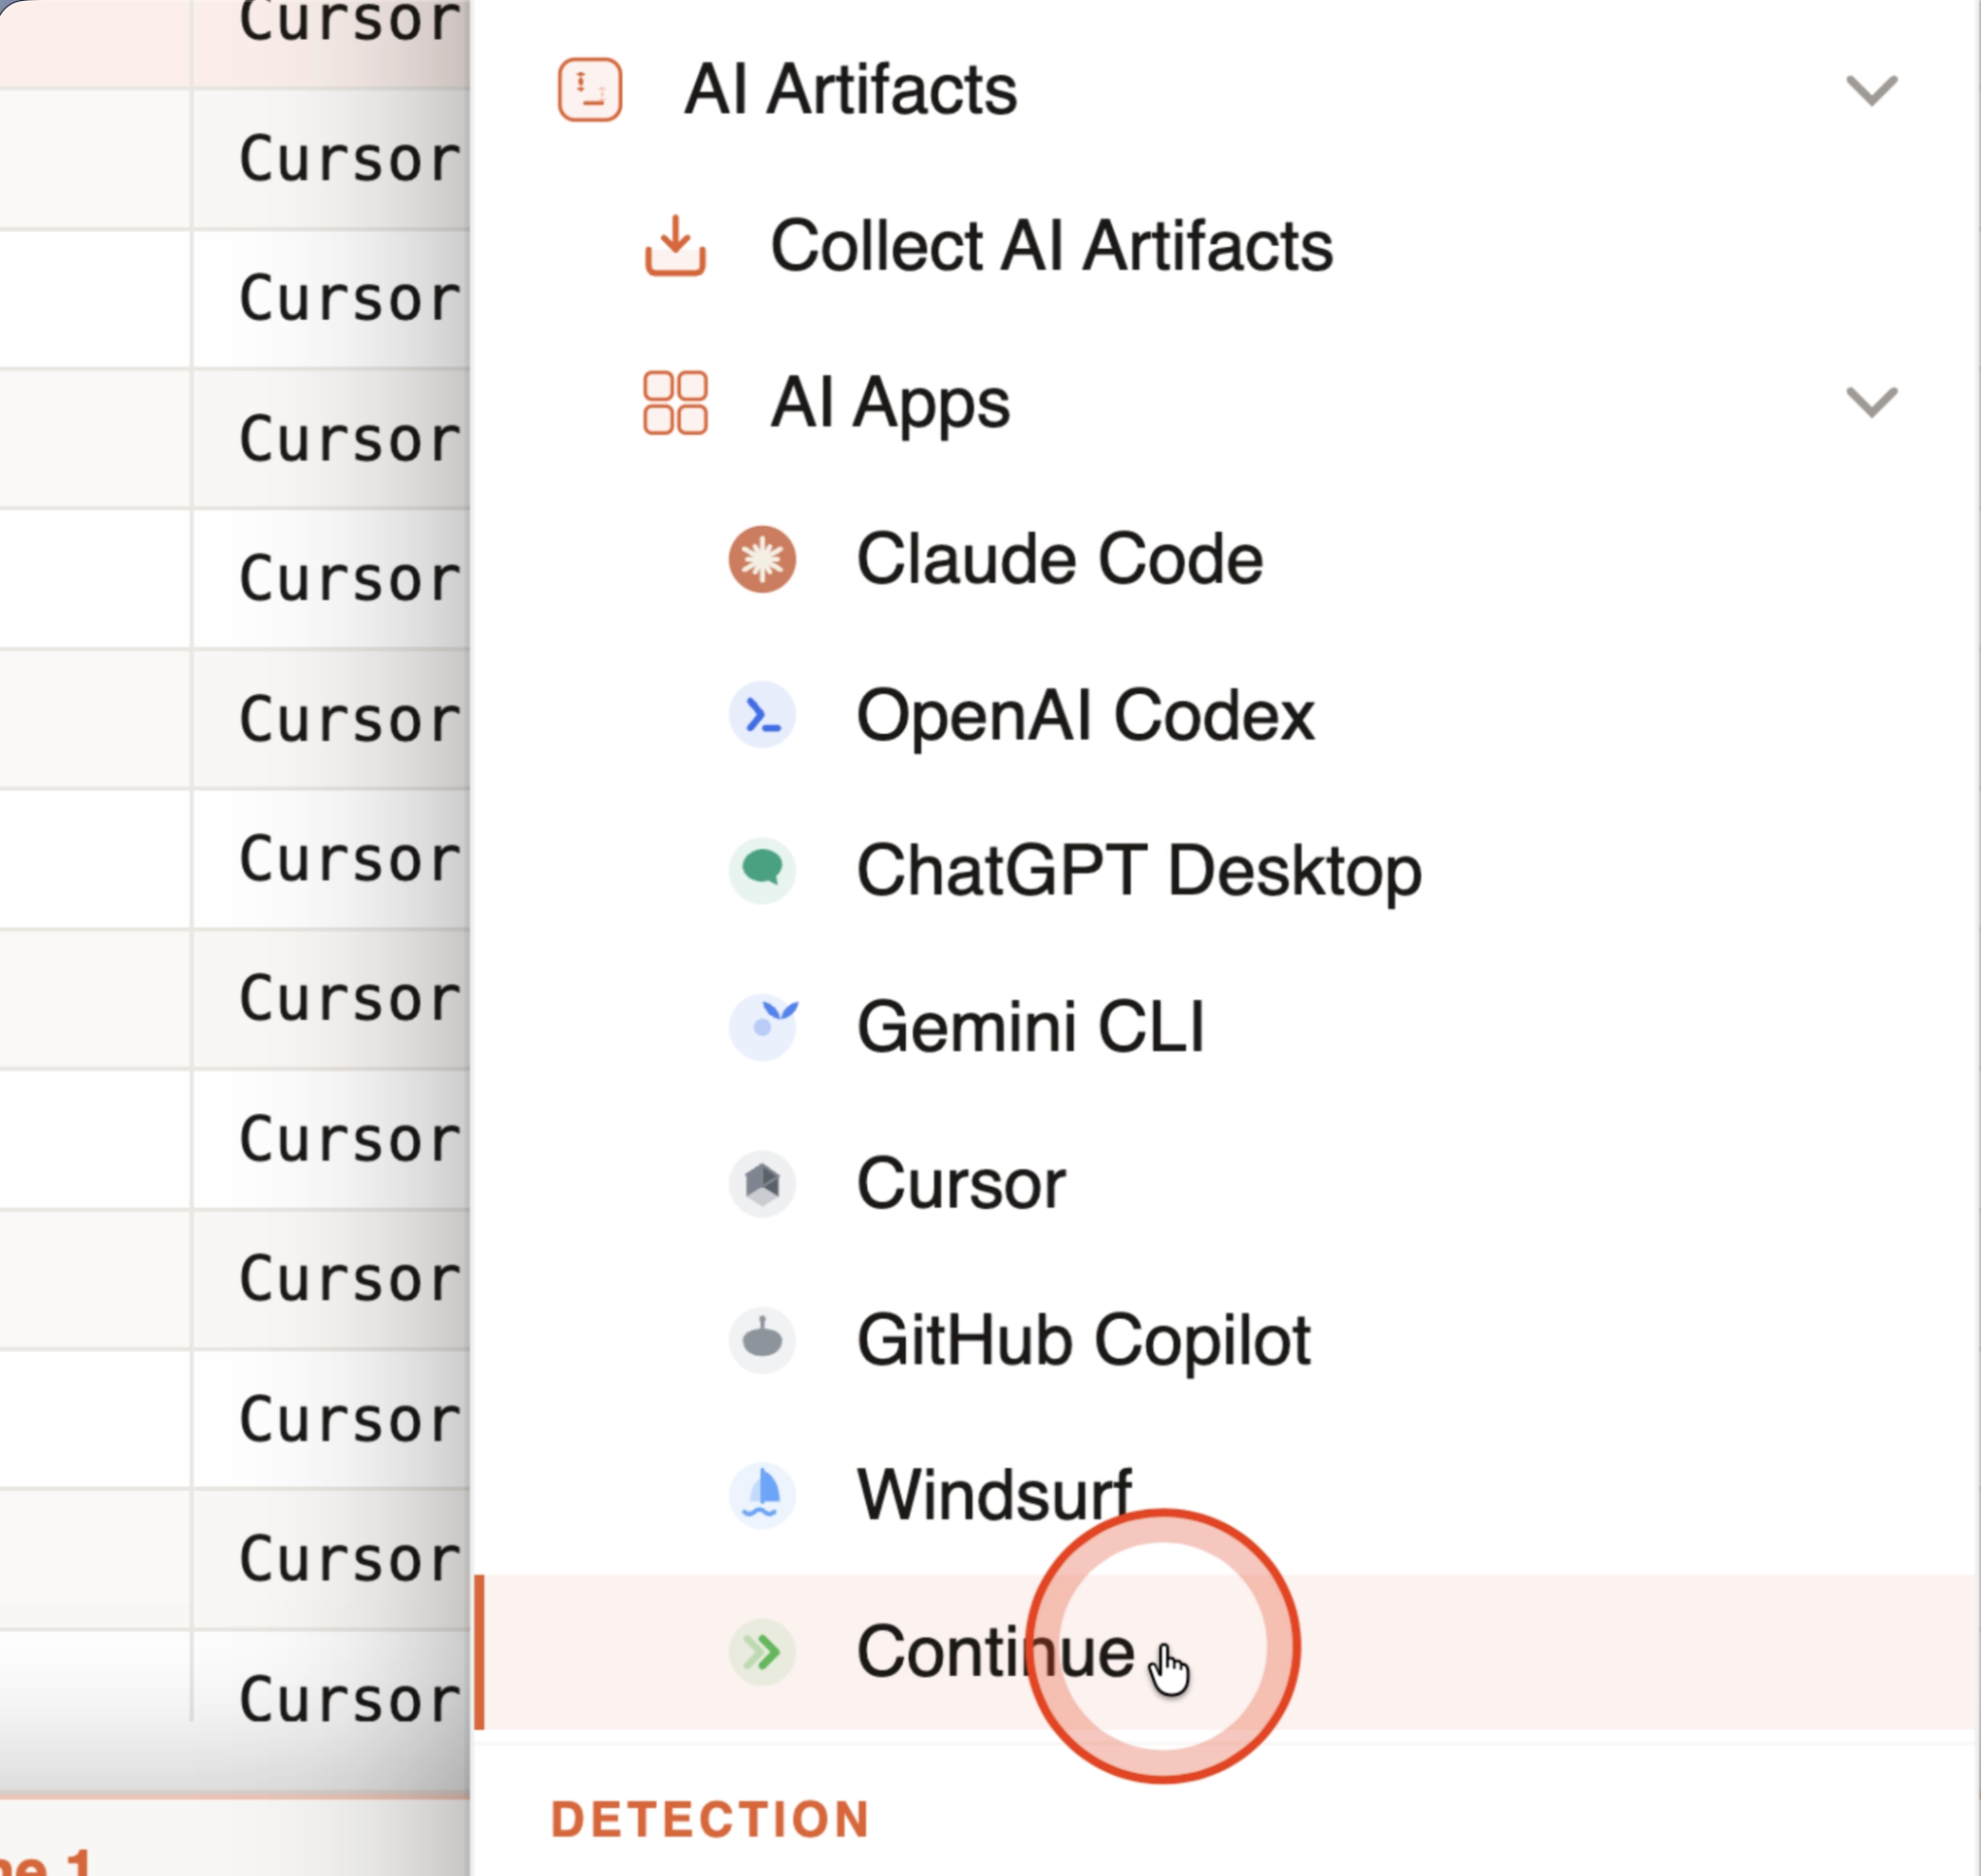
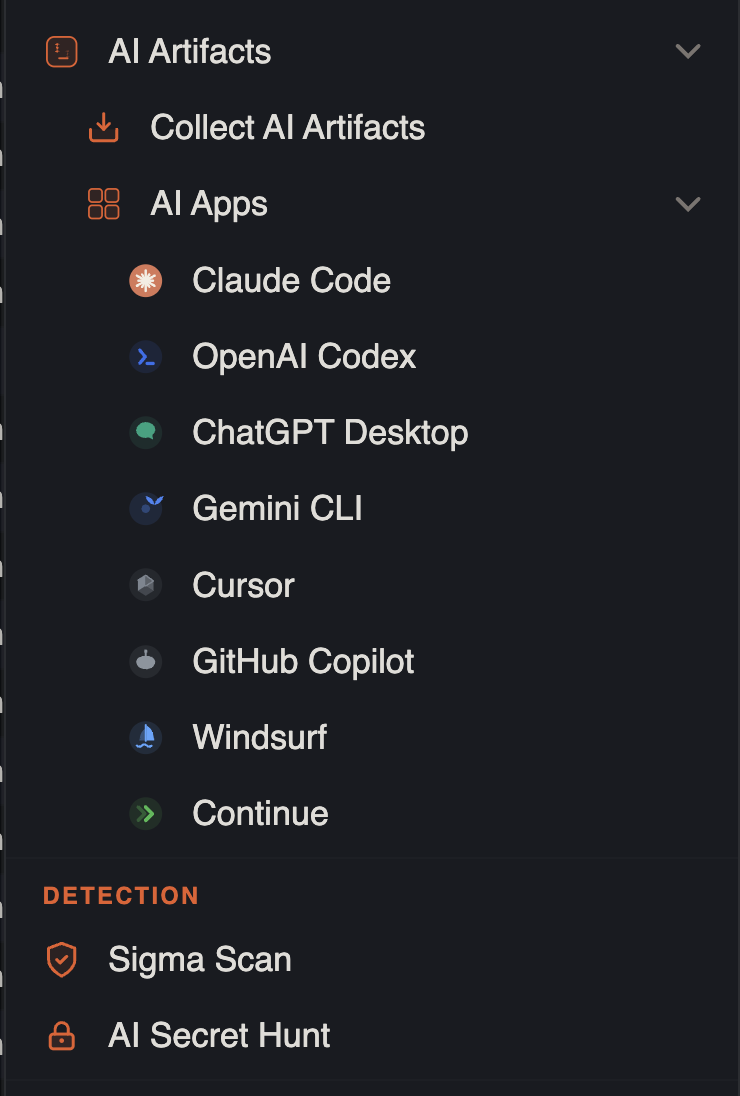
Open the Tools menu to run analysis. Tools are grouped into four sections — Analysis (timeline-wide analytics and AI Artifacts), Detection (Sigma Scan and AI Secret Hunt on AI history tabs), Platforms (OS-specific forensics), and Export (HTML report and AI history packages).
Under Platforms → Windows you will find Process Inspector, Lateral Movement Tracker, Persistence Analyzer, RDP Bitmap Cache, and nested Master File Table / USN Journal menus for raw NTFS artifacts. Linux, macOS, and Cloud groups list upcoming analyzers as placeholders.
For AI-assisted activity, use Tools → Analysis → AI Artifacts → Collect AI Artifacts to merge local assistant stores into one tab, or open a single app under AI Apps (Claude Code, OpenAI Codex, Grok Build, Grok Bot, ChatGPT Desktop, Gemini CLI, Cursor, Copilot, Windsurf, Continue). ChatGPT Computer History lives under AI Apps → OpenAI Codex → ChatGPT Computer History and opens in its own tab; Grok Build and Grok Bot live under AI Apps → Grok. After an AI Query History import, run Tools → Detection → AI Secret Hunt on that tab. See AI Query History.
For a fast first pass on event logs, choose Tools → Detection → Sigma Scan. Point it at a folder of raw .evtx files (bundled Hayabusa engine) or at your current timeline tab (in-app JS Sigma engine), pick the Fast high-confidence only preset, and run — findings open in a MITRE ATT&CK-mapped triage dashboard. See Sigma Detection for the full workflow.
Next Steps
- Learn about all search modes and filters
- Set up color rules for visual pattern matching
- Run rule-based detection with Sigma Detection
- Explore the Process Inspector for Sysmon analysis (Story / Graph / Rules health / Filter Grid)
- Open a full KAPE folder with File → Open Triage Collection… (KAPE workflow)
- Track lateral movement with the Lateral Movement Tracker
- Configure KAPE integration for auto-detection